
Understanding Key Candlestick Patterns in Trading
📊 Master candlestick patterns in trading to read market trends clearly! Learn to spot bullish, bearish, reversal, and continuation signals to trade smarter.
Edited By
Liam Foster
Candlestick patterns form the backbone of technical analysis in forex trading. They help you read price charts with more depth, revealing the battle between buyers and sellers in the market. For Pakistani traders, understanding these patterns offers a practical way to anticipate market turns and manage risk effectively.
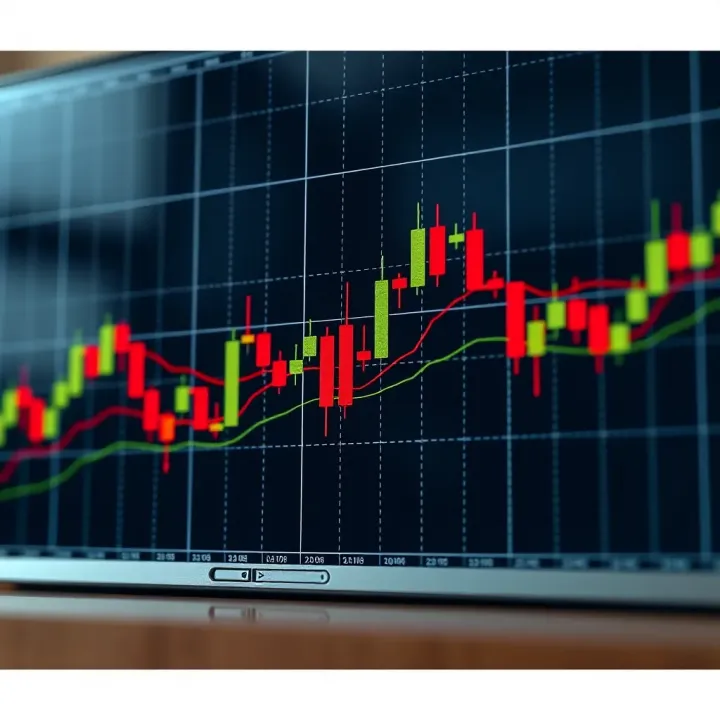
Forex candlestick charts display price movements over specified time frames—minutes, hours, or days. Each candlestick has four key pieces of information: the opening price, closing price, highest price, and lowest price during that period. This simple visual captures market sentiment like no other chart type.

A single candle might not show much on its own, but when you view patterns formed by a few candles, you can spot signals that precede market shifts. These signals fall mainly into two categories:
Reversal patterns: Indicate a change in the current price trend, signalling it may turn up or down.
Continuation patterns: Suggest the existing trend will carry on.
Take, for example, the popular "Hammer" candlestick. This pattern has a small real body near the top, a long lower wick, and little to no upper wick. In a downtrend, it signals that sellers pushed prices lower but buyers stepped in aggressively to close near the open. This often hints a bullish reversal might occur soon.
On the other hand, patterns like "Three White Soldiers" appear in an uptrend and consist of three consecutive bullish candles with higher closes. This signals strong buying momentum, suggesting the uptrend will continue.
Learning to recognise these patterns helps you make trading decisions rooted in market psychology rather than guesswork.
By analysing forex candlestick patterns, you can enhance entry and exit timing, reduce impulsive trades, and build a trading strategy that suits the local market conditions faced by Pakistani traders. Combining candlestick analysis with robust money management and fundamental factors such as news from SBP or geopolitical events can yield better overall results.
In the following sections, we’ll cover the most reliable candlestick formations, how to interpret them in real trades, and tips to avoid common pitfalls. This will help you make more confident forex trading decisions based on solid chart reading skills.
Forex candlestick charts form the foundation for many traders to understand market behaviour. Unlike simple line charts, candlesticks provide detailed insights into price action within specific timeframes, showing opening, closing, high, and low prices. This richer information helps traders make more informed decisions, whether entering or exiting trades.
A candlestick consists mainly of the body, shadows, and wick (often used interchangeably with shadows). The body represents the price range between the opening and closing levels of the currency pair during the chosen timeframe. If the price closes higher than it opened, the body usually appears in a lighter colour (often white or green), signalling upward movement. Conversely, a darker or red body indicates the price has fallen.
Shadows (or wicks) extend above and below the body, showing the highest and lowest prices reached within that period. For example, if the upper shadow is long, it means the price reached higher levels but couldn’t sustain them, potentially signalling resistance. Shadows help traders identify volatility and indecision in the market.
The key difference lies in the direction of price movement during the period. A bullish candlestick closes higher than it opened, suggesting buying pressure. In forex trading, spotting a series of bullish candles may indicate a strengthening currency. For instance, if the USD/PKR shows consecutive bullish candlesticks on a 1-hour chart, it could signal rising demand for the US dollar.
On the other hand, a bearish candlestick closes lower than it opened, pointing to selling pressure. This can warn traders of a potential downtrend or correction. Recognising bearish candles near known resistance levels might prompt a trader to consider short positions or tighten stop-loss orders.
Candlestick charts reveal more than just price; they tell a story about market psychology. By observing candlestick formation, traders interpret shifts between buyers and sellers. For example, a long bullish candlestick following a downtrend might suggest a reversal as buyers regain control.
Reading these patterns requires attentiveness to details like body size and shadow length. A narrow body combined with long shadows, like a doji, often signals indecision, cautioning traders before taking action.
Timeframes affect the significance of candlestick patterns. A bullish engulfing pattern on a 5-minute chart shows short-term price movement and may not carry the same weight as the same pattern appearing on a daily chart. Pakistani forex traders often prefer longer timeframes such as 4-hour or daily charts to avoid noise caused by intraday fluctuations.
Different strategies suit different timeframes. For example, scalpers rely on 1- to 15-minute charts to capture small moves, while swing traders analyse daily or weekly charts for broader trends. Understanding the role of timeframe helps traders adjust their analysis and risk management accordingly.
Effective use of forex candlestick charts demands grasping both their structure and behavioural clues they provide across various timeframes—this can turn raw data into strategic advantage for traders.
Recognising common forex candlestick patterns helps traders anticipate market moves and make better decisions. These patterns distill price action into easily understood shapes, revealing shifts in trader sentiment. Whether you are spotting a quick bounce or a major trend change, knowing these formations sharpens your timing and risk control.
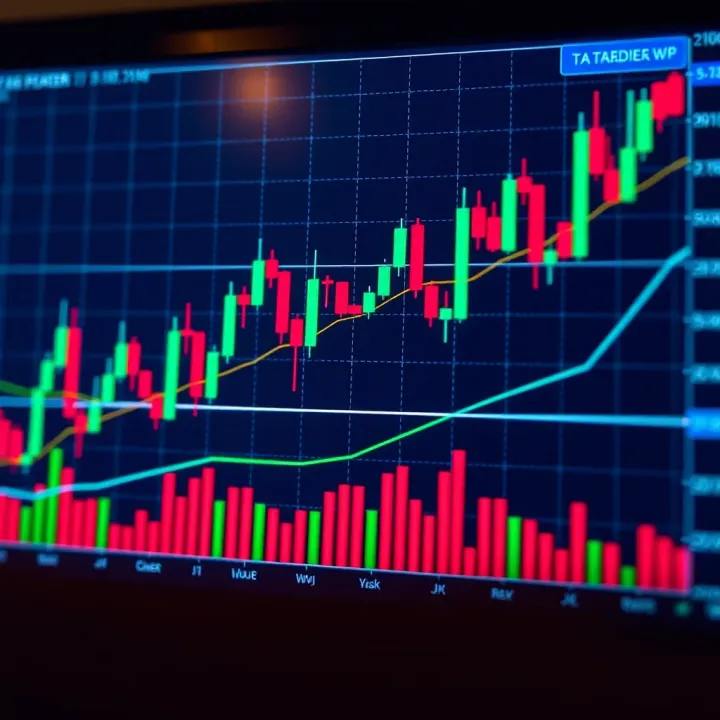
These two shapes look alike but signal different things depending on the trend. A Hammer appears after a downtrend and suggests buyers are stepping in, potentially reversing the slide. Picture a candlestick with a small body near the top and a long lower wick—watch how price tests lower levels but closes strong. For example, on the PKR/USD chart, a hammer after sustained decline might hint that the rupee’s slide is near exhaustion.
On the other hand, a Hanging Man shows up after an upswing and warns of possible weakness. Even though it closes near its open, the long lower shadow means sellers pushed price down but buyers managed to recover somewhat. It signals caution for traders riding the bull run.
When you see a Doji, it means neither buyers nor sellers controlled the market, resulting in a near-even open and close. This indecision often precedes a shift in direction or a pause. A Doji on a strong trend signals momentum might be faltering. For instance, if a Doji appears on a rising PKR/EUR chart, traders should watch for signs of slowing uptrend.
A Spinning Top also displays a small body but with longer shadows on both sides. This pattern reflects uncertainty, where bulls and bears are battling without clear victory. It’s a useful clue that a current trend might be losing steam.
In these patterns, a larger candle completely covers the previous candle’s body, indicating a strong shift in sentiment. A Bullish Engulfing pattern occurs when a green candle overtakes a smaller red one, often revealing buyers taking control after a downtrend. Conversely, a Bearish Engulfing sees a bigger red candle swallow a smaller green candle, suggesting sellers overpowering bulls.
Traders rely on engulfing patterns as reliable reversal indicators. For example, after days of rupee weakness, a bullish engulfing on the PKR/JPY chart might invite buying interest.
These three-candle patterns highlight trend reversals with more clarity. A Morning Star starts with a strong bearish candle, followed by a small-bodied candle showing indecision, then a bullish candle closing well within the first candle’s body. This sequence often marks a bottom and a potential rise.
The Evening Star works opposite—starting with a strong green candle, then indecision, and finally a bearish candle engulfing part of the first. It tells traders that a peak may be forming.
Spotting these stars can help manage trades more confidently, reducing chances of getting caught on the wrong side.
Both are two-candle reversal signals. The Piercing Line shows a bearish candle first, followed by a bullish candle opening lower but closing above the midpoint of the previous candle. This pattern suggests buyers are pushing back strongly after a dip.
On the flip side, the Dark Cloud Cover starts with a bullish candle and then a bearish candle that opens higher but closes below the midpoint of the previous green candle, signalling seller strength.
These formations help traders spot entrances or exits early, especially in volatile forex pairs.
Recognising these common candlestick patterns and understanding their meanings offer practical tools for reading market sentiment and timing trades better. Combining them with other analysis will strengthen your trading edges.
Reversal candlestick patterns signal a potential change in the current trend direction. Recognising these patterns can be a game-changer, especially when you want to avoid getting caught on the wrong side of the market. For forex traders, spotting these early could mean seizing an entry point before a bullish run kicks off or cutting losses before a bearish slide.
Market trends don't keep going indefinitely. Reversals happen when buyers or sellers lose momentum, and the opposite side gains control. For example, after a steady rise, profit-taking might trigger enough selling pressure to flip the trend downwards. Similarly, weak support might encourage buyers to step in, shifting a downtrend into an uptrend. Understanding these shifts helps traders anticipate the next move rather than reacting late.
Certain hints suggest a trend may be about to turn. A slowing momentum in price movement, reduced trading volume during trend continuation candles, or the appearance of hesitation candlesticks like Doji often signal uncertainty among traders. These signs, especially when confirmed by reversal patterns, can reveal that the current trend is losing steam. Pakistani traders should watch candlestick bodies shrinking or sudden long wicks appearing, which often indicate buyers or sellers testing new levels.
Double tops form when the price peaks twice near the same resistance level but fails to break higher, suggesting selling pressure is rising. Conversely, double bottoms appear when price tests a support level twice but doesn't drop further, showing buyers are stepping in. For instance, a currency pair stuck around Rs 280 might form a double top if it hits that level twice and pulls back each time, signalling a potential sell-off.
The engulfing pattern happens when a candlestick completely covers the previous one’s body, indicating a strong reversal signal. A bullish engulfing pattern appears after a downtrend when a large green candle swallows a preceding smaller red candle. This means buyers are retaking control. The opposite, a bearish engulfing, signals sellers gaining strength at the top of an uptrend. These patterns work well with support or resistance zones for added confirmation.
Doji stars show indecision in the market. Their tiny bodies mean opening and closing prices are nearly the same, reflecting balance between buying and selling forces. When a Doji forms after a strong trend, it often warns that momentum is fading, and a reversal could follow. Pakistani traders frequently spot Dojis near psychological levels—like Rs 300 for a currency pair—indicating hesitation before the trend changes.
Reversal candlestick patterns are powerful tools, but combining them with other analysis and sound risk management will improve your trading outcomes in the volatile forex market.
Continuation patterns indicate that the current market trend is likely to carry on, rather than reverse. For forex traders, recognising these patterns helps avoid premature exits or entries that go against the prevailing direction. Essentially, they signal pauses or consolidations before the price moves further along the established trend.
By spotting continuation patterns, traders can confidently hold their positions or add to them, optimising potential gains while managing risk more effectively. These patterns are especially valuable in volatile markets like forex where price swings often look erratic but still follow broader trends.
Definition and importance in market trends
Continuation patterns form when the price undergoes a brief consolidation or pullback within a strong trend. Instead of flipping direction, this pause offers the market a moment to catch its breath before pushing further. These patterns maintain the trend’s momentum and indicate that traders’ confidence in the prevailing move remains intact.
In practice, continuation signals help forex traders identify opportune moments to enter or hold their trades in line with the dominant trend. This reduces guesswork and lessens the chances of acting on false signals.
How to confirm continuation signals
Confirmation usually involves watching for specific price actions and volume changes around the pattern. For example, a breakout in the original trend’s direction after the consolidation phase acts as a green light. Additionally, technical indicators like volume spikes or moving average alignment can support the validity of the continuation.
Practical confirmation keeps traders from jumping in too early during minor retracements or false breaks. For instance, if the price breaks above a flag formation on strong volume, it’s safer to assume the bullish trend will resume.
Rising and Falling Three Methods
These are classic continuation patterns showing brief pauses within an uptrend or downtrend. The rising three methods consist of a long bullish candle followed by several small bearish candles remaining within the previous candle’s range, then a strong bullish candle closing near the high. This suggests minor profit-taking before buyers take control again.
The falling three methods mirror this in a downtrend, where a long bearish candle is briefly interrupted by small bullish candles, followed by a decisive bearish candle confirming sellers’ dominance. Both patterns offer traders clear visual cues to maintain positions aligned with the trend.
Flags and Pennants
Flags appear as small rectangles slanting against the trend, formed by parallel trendlines during short consolidations. Pennants look like small symmetrical triangles that reflect indecision before the trend resumes. Both indicate a brief pause rather than a reversal.
For example, during a strong uptrend, a flag pattern can appear after a sharp price rise, signalling traders to wait for breakout confirmation before adding to longs. Similarly, pennants often form after sudden moves due to news releases or economic data, preparing traders for continuation once price breaks out.
Recognising these patterns can help you hold your nerve during market pauses, avoiding premature exits and aligning with the main trend for better gains.
Key takeaways for Pakistani forex traders include watching volume during breakouts and combining these patterns with other indicators like moving averages for stronger confirmation. Such practices lead to smarter trade decisions even in busy or fluctuating markets.
Candlestick patterns offer valuable insight for forex traders, but applying them effectively requires joining these patterns with broader trading strategies. They are not standalone signals. Using them alongside other tools helps verify market direction, reduce false signals, and ultimately make better trading decisions. For instance, spotting an engulfing pattern near a key support level gives more confidence in a trade setup than seeing it in isolation.
Support and resistance levels play a vital role when analysing candlestick patterns. These horizontal price zones often act as barriers where price action pauses or reverses. When a reversal candle, like a hammer or shooting star, forms close to such levels, it increases the likelihood that the reversal is genuine. For example, if the forex pair USD/PKR has a strong resistance at Rs 280 and you see a bearish engulfing candle forming near this price, this suggests sellers are likely stepping in at that point.
Moving averages and Relative Strength Index (RSI) further improve candlestick analysis by offering trend and momentum confirmation. A rising moving average confirms an uptrend, so bullish candlestick patterns aligning with this trend carry more weight. RSI helps detect overbought or oversold conditions. If RSI shows oversold conditions while you spot a hammer candle, it strengthens the chance of a bounce. In contrast, an RSI reading above 70 combined with a bearish pattern might warn of a pending correction. Pakistani traders often combine a 20-period moving average with candlestick signals to time entries more precisely.
Avoiding false signals in volatile markets is critical. Pakistan’s forex pairs can show sudden jumps during political events or economic news releases, leading to candlestick patterns that don't play out. Traders should watch for strong volume confirmation or wait for price to close beyond key levels before acting. For instance, during SBP policy announcements, price spikes might produce misleading wick-heavy candles. Ignoring such impulsive moves helps avoid costly mistakes.
Risk management when using candlestick patterns cannot be overstated. No pattern guarantees success, so setting stop-loss orders and managing position sizes according to your risk tolerance is essential. A popular approach is placing a stop-loss just beyond the opposite side of the candlestick pattern. For example, if buying on a bullish engulfing near support, a stop-loss slightly below that support keeps losses minimal if the market moves against you. Proper risk management keeps your trading sustainable over time, especially when Pakistani forex markets can swing unpredictably.
Using candlestick patterns thoughtfully with other indicators and solid risk controls improves your trading edge — it’s about smart confirmation, not guessing.
In short, combining candlestick analysis with support/resistance and indicators like moving averages and RSI enhances decision-making. Pakistani traders should also factor in local market volatility and maintain strict risk management to protect capital. This balanced approach utilises candlesticks as a part of a wider strategy, not a sole tool, leading to smarter forex trading choices.
📊 Master candlestick patterns in trading to read market trends clearly! Learn to spot bullish, bearish, reversal, and continuation signals to trade smarter.
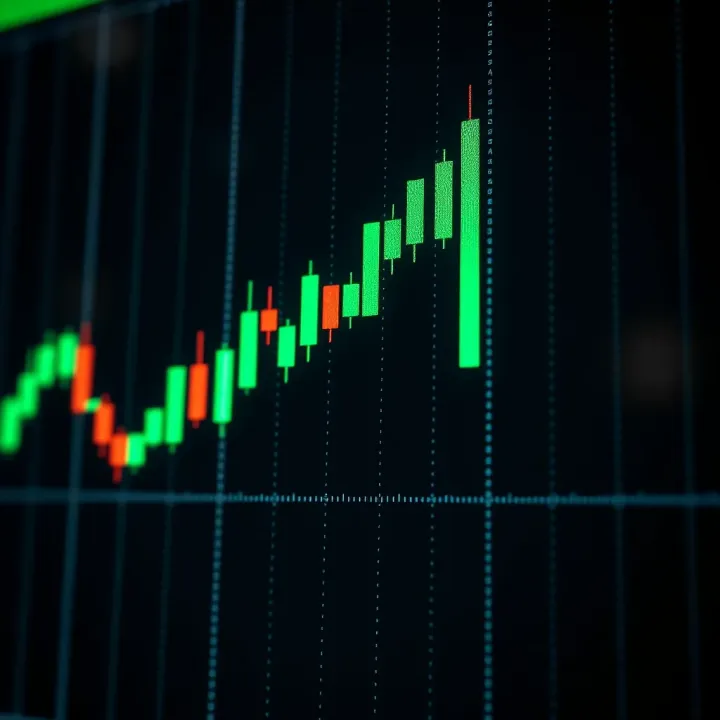
📈 Learn how strong bullish candlestick patterns signal upward price moves in trading. Understand key formations, interpretation, and integration with other indicators for smarter decisions.
📉 Learn key bearish candlestick patterns in trading, spot downtrends early, avoid common mistakes, and combine signals for smarter market decisions.
📈 Master advanced candlestick patterns for precise trading decisions. Understand complex formation, interpretation & practical uses in Pakistan's markets.
Based on 9 reviews