
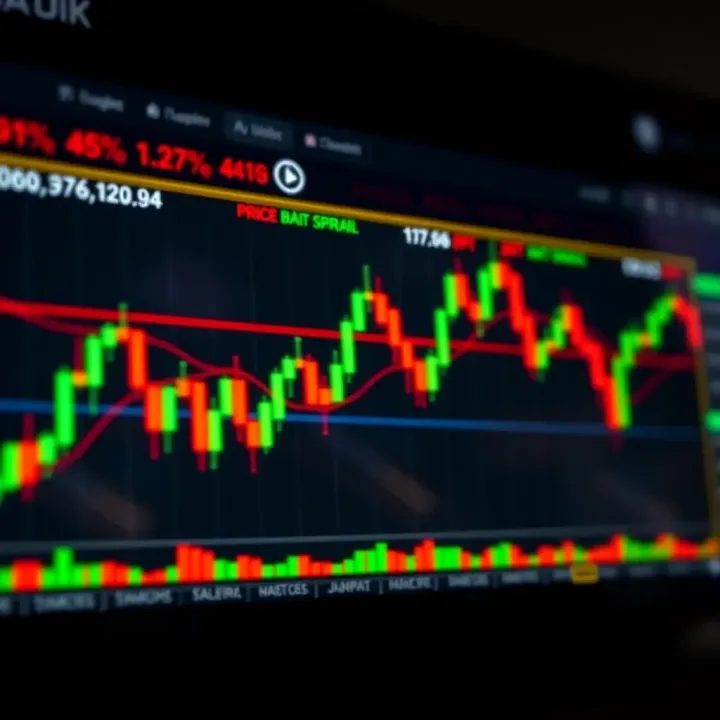
Understanding Key Candlestick Patterns in Trading
📊 Master candlestick patterns in trading to read market trends clearly! Learn to spot bullish, bearish, reversal, and continuation signals to trade smarter.
Edited By
William Harris
Single candlestick patterns form a simple yet powerful tool to quickly gauge market direction in trading. Unlike complex multi-candle formations, these patterns focus on just one candlestick’s shape and position to provide insights into market sentiment.
At its core, a candlestick charts the open, high, low, and close prices within a specific time frame, such as one hour, a day, or even a week. Each candlestick visually represents the battle between buyers and sellers. Traders watch single candlestick patterns to spot moments when either buyers or sellers might be gaining the upper hand, signalling possible price reversals or continuations.

Some of the widely recognised single candlestick patterns include the Hammer, Shooting Star, Doji, and Marubozu. For example, a Hammer shows a small body with a long lower shadow, often suggesting that sellers pushed the price down but buyers regained control before the close — a potential bullish signal. Conversely, a Shooting Star indicates the opposite on an uptrend, potentially signalling a bearish reversal.
Successful use of these patterns requires understanding market context, volume confirmation, and the specific behaviour of Pakistani exchanges like the PSX, as price reactions may differ from global markets.
Traders in Pakistan often face market conditions influenced by factors such as political events, economic policy changes, currency fluctuations, and even loadshedding schedules that affect trading volumes. So, reading single candlestick patterns alongside local news and broader technical indicators improves reliability.
To get practical:
Identify the main candlestick patterns suited to your trading timeframe.
Combine pattern signals with volume and support/resistance levels to reduce false signals.
Avoid blind reliance on single patterns without broader trend analysis, especially in volatile markets.
Mastering single candlestick patterns equips traders and investors with quick entry and exit signals, helping to time trades more effectively. In a fast-moving market like Pakistan’s, this quick insight can make a significant difference in minimising risks and maximising returns.
Understanding these basics sets the stage for deeper exploration of each pattern, their formation, and how to apply them wisely in your trading strategy.
Single candlestick patterns provide traders with fast, clear clues about market sentiment and potential price changes. These patterns appear on candlestick charts, a tool that visually captures how price moves over a specific time—the open, close, high, and low. For traders in Pakistan’s stock market or forex scene, understanding these single-candle signals helps make timely decisions without waiting for longer, complex patterns to form.
A candlestick chart displays price information for a particular period (for example, one hour or one day) using "candles." Each candle has a body representing the difference between opening and closing prices, and shadows (or wicks) showing the highs and lows. Single candlestick patterns focus on just one candle to interpret market behaviour in that time slice.
These one-candle formations serve as quick indicators, such as indecision or potential reversals. For example, a doji candle, where opening and closing prices are almost the same, flags market uncertainty or a possible change in trend.
The key difference between single and multiple candlestick patterns lies in complexity and timing. Multiple candlestick patterns involve reading two or more candles in sequence to detect patterns like engulfing or morning star setups—these offer deeper confirmation but take longer to develop. Single candlestick patterns trade speed for simplicity, allowing traders to react swiftly, a useful edge in fast-moving markets.
One major advantage of single-candle patterns is their simplicity and speed. They provide instant feedback from the price action without waiting for a series of candles, which suits short-term traders or intraday traders who act on minute-to-minute changes. For example, spotting a hammer candle after a price dip can hint at a potential bounce-back immediately.
These patterns also work well alongside other tools, like volume or moving averages, boosting confidence in trade setups.
In practice, traders often use single candlestick signals in volatile market phases or when managing quick entries and exits. Suppose a spinning top forms during sideways trading on the Pakistan Stock Exchange (PSX), it signals indecision—traders might hold off on placing big bets until clearer direction emerges.
Recognising single candlestick patterns is a quick way to gauge market mood, especially helpful in Pakistan’s dynamic trading environment where price swings can be sharp and sudden.
In summary, knowing single candlestick patterns lets you make faster, more informed decisions while managing risk effectively. It’s a skill worth mastering for anyone serious about trading in PSX, forex, or commodities markets.
Single candlestick patterns serve as quick snapshots in chart analysis. In trading, especially on platforms like the Pakistan Stock Exchange (PSX), recognising these patterns helps to read market sentiment and make timely decisions. They provide early hints about potential price movement, allowing traders and investors to act before trends fully establish.
Understanding key patterns means being able to distinguish how price behaves within a single trading session (or candle period). For instance, a particular pattern might suggest indecision or a possible reversal. Traders often use these patterns alongside volume and other indicators to improve their accuracy.
A Doji candle forms when the opening and closing prices are almost equal, resulting in a very small body with long or short shadows. This shape indicates that buyers and sellers are in balance during that session. Because the body is small, it signals uncertainty or hesitation in the market.
When a Doji appears after a sharp rise (bullish trend), it suggests that buying pressure is weakening, possibly leading to a price reversal or pause. On the downside, a Doji after a fall points to sellers losing momentum and may signal an upcoming bullish turnaround. In both cases, the Doji acts as a warning sign, but confirmation from following candles or indicators is needed before acting.

Both candles have small bodies with long lower shadows and little or no upper shadow. The hammer forms after a decline, while the hanging man appears after a rise. The key difference lies in their position within the trend and their implications.
A hammer indicates that despite strong selling during the session, buyers pushed the price back up, suggesting the start of an upward reversal. Conversely, a hanging man warns that despite a rally, sellers appeared strong and could push prices down soon. However, these patterns need confirmation from the next trading session's candle for higher reliability.
A spinning top features a small body with upper and lower shadows of similar length. This balance shows that neither buyers nor sellers gained clear control during the session.
This pattern often signals market indecision and uncertainty. If a spinning top appears after a trending move, it may suggest slowing momentum and a possible pause or reversal. Traders treat spinning tops as caution signs, looking for additional evidence before making decisions.
Spotting a spinning top alongside declining volume, for example, could suggest a weakening trend.
Marubozu candles have no shadows; their open and close mark the session’s high and low. A bullish Marubozu opens at the low and closes at the high, showing strong buying. A bearish Marubozu opens at the high and closes at the low, displaying dominant selling.
These candles reflect clear conviction from buyers or sellers without hesitation. On the PSX, a Marubozu may precede powerful breakouts or breakdowns. Traders take Marubozu as strong trend signals, but remember that sudden news or events in Pakistan’s market can also result in volatile Marubozu formations.
Understanding these four patterns deepens insight into the market’s pulse. While they simplify complex moves, applying them carefully alongside other tools helps traders navigate Pakistan’s unique market environment.
Single candlestick patterns serve as valuable signals for traders aiming to get quick insights into market moves. However, using them effectively calls for combining these patterns with additional tools and understanding local market behaviour. Relying solely on a single candle without extra confirmation can end up misleading, especially in volatile markets like Pakistan.
Volume plays a key role in strengthening the signals given by single candlestick patterns. For example, a hammer candle forming on high volume usually suggests stronger buying interest than the same hammer on low volume. This is because volume reflects the actual participation behind price moves. A Doji candle followed by rising volume might indicate indecision but with potential for a sharp move once the market decides its direction.
Besides volume, combining candlestick patterns with trend indicators such as Moving Averages (MA) or the Relative Strength Index (RSI) helps avoid false signals. When a Marubozu candle appears near a 50-day moving average breakout, it adds weight to the probability of a genuine trend start. Meanwhile, spotting a Spinning Top candle during an overbought RSI situation could hint at an impending pullback rather than a sustained rally.
Using these additional indicators alongside candlestick cues reduces guesswork and provides a clearer trading edge.
Consider PSX data during a recent trading session of a major stock like Pakistan Petroleum Limited. A hanging man candle appeared after a strong rally, but the signal only proved reliable once confirmed by declining volume and a bearish crossover in MACD (Moving Average Convergence Divergence). Traders who jumped in solely on the hanging man risked losses; those waiting for confirmation saved capital.
Adapting patterns to Pakistan’s market also means recognising the influence of local events, such as political announcements or currency fluctuations, which can amplify or mute candlestick signals. For instance, a Doji candle formed during a period of economic uncertainty might not behave as usual, since traders react more to news than pure technicals. Thus, experienced investors combine candlestick analysis with ongoing market news and regulatory factors to time their trades better.
Using candlestick patterns with volume, trend indicators, and understanding the Pakistan-specific context helps traders avoid pitfalls and improve decision-making.
In summary, single candlestick patterns offer quick clues, but they deliver the best results when woven into a broader strategy that considers volume, trend strength, and local market conditions specific to PSX and Pakistan’s trading environment.
Single candlestick patterns can be handy tools for traders seeking quick market insights. However, they come with limitations and risks that every trader must recognise. Relying solely on these patterns without considering broader analysis can lead to misjudgments and financial loss. This section highlights the common pitfalls and contextual factors affecting their reliability, particularly within Pakistan's unique market environment.
Single candlestick patterns often generate false signals due to market noise—random price fluctuations that don’t reflect meaningful trends. For example, a hammer candle might appear during intraday volatility but fail to signal a true market reversal. Such misleading cues can tempt traders into premature buy or sell decisions.
Over-enthusiasm for single patterns can blind traders to the bigger picture. If you act on an isolated candlestick without checking volume or confirming with other indicators, you risk falling into traps created by short-term price spikes. Pakistani markets, featuring sudden liquidity shifts and news-driven spikes, can amplify these false signals. One must stay cautious and confirm signals before trading.
It’s risky to rely only on single candlestick patterns without integrating them into a larger trading framework. These patterns are snapshots; they don’t capture the full market narrative or fundamental factors influencing price moves. Traders should use them as one of several tools, combining them with trend analysis, volume data, and economic news.
For instance, a bearish spinning top in isolation may suggest hesitation among sellers, but without confirming whether the overall trend is weakening, selling based on this alone may backfire. Experienced Pakistani traders often wait for at least two or three confirming signals before entering a position. This approach reduces whipsaw effects and helps preserve capital.
Candlestick patterns must be interpreted in context to gain accuracy. A hammer in a strong uptrend usually means something different than a hammer after a prolonged downtrend. The same pattern might indicate reversal in one scenario or just temporary pause in another.
Understanding market phases, local economic factors, and event-driven risks is vital. In Pakistan, political news, central bank policies, and foreign exchange rates can heavily influence market sentiment. Such factors shape how much weight one should put on a single candle pattern.
Pakistan’s stock market often experiences increased volatility around election periods, budget announcements, or geopolitical tensions. These conditions can distort usual pattern interpretations. For example, during the pre-budget season, candlestick signals might become less reliable due to speculative trading.
Moreover, market liquidity can vary greatly between different PSX sectors. Lower liquidity in small cap stocks intensifies price swings, which may create deceptive candlestick patterns. On the other hand, blue-chip stocks with stable volumes offer more dependable signals. Traders should adjust their strategy accordingly, focusing on volume and market context to avoid being misled.
Successful trading in Pakistan demands combining candlestick pattern analysis with contextual awareness and risk management, ensuring decisions are supported by solid evidence rather than isolated price signals.
Understanding these limitations helps you use single candlestick patterns more wisely and avoids costly mistakes in your trading journey.
Single candlestick patterns can offer useful clues about market sentiment, but relying on them in isolation often leads to errors. To use these patterns effectively, traders should adopt best practices that blend candlestick signals with broader analysis and sound risk management. Doing so enhances decision-making and protects capital in Pakistan’s sometimes volatile markets.
While candlestick patterns reflect short-term price action, fundamental analysis explains why prices move over the long term. For example, if you spot a hammer pattern on a stock chart but the company has poor quarterly earnings and negative sector outlook, the bullish signal might lack strength. Conversely, a strong single candlestick reversal in a fundamentally sound company — say, one benefiting from government infrastructure investments under CPEC — can carry more weight.
Traders in Pakistan’s equity markets can greatly benefit by layering fundamental signals such as earnings growth, dividend policies, or macroeconomic factors like SBP’s monetary policy alongside candlestick readings. This combination helps avoid false moves driven by market noise alone.
Candlestick patterns should never be used randomly or as standalone tips. Successful trading demands a clear plan specifying entry and exit rules, capital allocation, and acceptable risk per trade. Single candlestick signals can serve as triggers within this plan.
For instance, a trader watching the KSE-100 index might wait for a confirming Doji candle near support level before initiating a position. Decisions about taking profits or cutting losses can then depend on subsequent price action, not just the initial candle.
In practice, establishing a checklist that includes pattern verification, volume confirmation, and alignment with overall trend keeps emotions in check and ensures disciplined trades.
Stop-loss orders help protect against sudden adverse price moves. When using single candlestick patterns, place stop-losses just beyond the candle’s extreme shadow (wick) or a nearby support/resistance level.
For example, if a hammer candle signals a potential bounce at Rs 120 per share on a Pakistani stock, setting a stop-loss just below the candle’s low — say, Rs 118 — limits downside if the pattern fails. This approach prevents large losses from disproven signals and avoids catastrophic outcomes during market shocks such as political uncertainty or loadshedding impacts.
Even the most reliable candlestick signals can fail. Managing how much capital you allocate per trade is crucial. Use position sizing techniques that link your maximum risk per trade to a small percentage of total investment funds — commonly 1-2%.
For instance, if your trading capital is Rs 1 crore, risking Rs 1 lakh per trade avoids blowing your account on one bad signal. Also, diversify across sectors or instruments to cushion against sector-specific risks prevalent in Pakistan’s markets (like textile or energy).
By combining proper position sizing with candlestick-based stops, traders safeguard capital and maintain longevity, allowing them to benefit from future opportunities.
Effective use of single candlestick patterns demands more than spotting shapes—it requires disciplined integration with broader analysis and prudent risk controls. This balance helps unlock their potential in Pakistan’s dynamic trading environment.
📊 Master candlestick patterns in trading to read market trends clearly! Learn to spot bullish, bearish, reversal, and continuation signals to trade smarter.

📈 Learn how strong bullish candlestick patterns signal upward price moves in trading. Understand key formations, interpretation, and integration with other indicators for smarter decisions.
📉 Learn key bearish candlestick patterns in trading, spot downtrends early, avoid common mistakes, and combine signals for smarter market decisions.
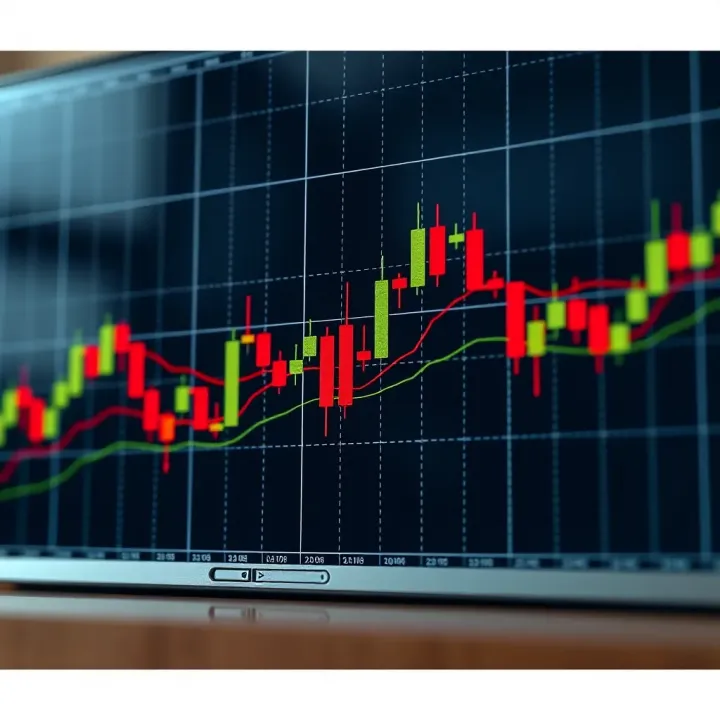
📈 Master advanced candlestick patterns for precise trading decisions. Understand complex formation, interpretation & practical uses in Pakistan's markets.
Based on 9 reviews