

Guide to Chart Patterns in Trading
📊 Explore key chart patterns traders use to read market trends effectively. Learn types, traits, and what they signal to sharpen your trading skills today.
Edited By
Emily Clarke
Trading chart patterns serve as a vital tool for Pakistani traders, investors, and financial analysts looking to anticipate future price movements. They simplify complex market data into identifiable shapes, making it clearer when to enter or exit trades. Understanding these patterns enhances decision-making and can potentially increase profits while managing risks.
A chart pattern appears when price action creates a distinct formation, signalling either continuation or reversal of the current trend. For example, a "Head and Shoulders" pattern might indicate an upcoming market reversal, while a "Cup and Handle" pattern often suggests a bullish continuation.

Pakistani traders often face challenges like limited access to localised educational resources or reliable market data platforms. That’s why having free, downloadable PDFs that cover essential chart patterns can be a game-changer. These PDFs provide structured explanations along with visual examples, helping even beginners grasp complex concepts quickly.
Recognising and interpreting chart patterns depends on practice and context; relying solely on them without considering market conditions like macroeconomic news or political developments can lead to mistakes.
Commonly used patterns you’ll find in these free resources include:
Triangles (ascending, descending, symmetrical) – indicating consolidation before a breakout
Double Tops and Bottoms – signalling potential trend reversals
Flags and Pennants – pointing to short pauses before the current trend resumes
Rising and Falling Wedges – often predecessors to significant market moves
PDF guides tailored for Pakistani traders sometimes integrate local market nuances such as the Pakistan Stock Exchange (PSX) behaviour, impact of rupee fluctuations, or effects of government policies on stocks. This practical approach is more useful than generic global examples.
To get the most out of chart pattern PDFs:
Study the graphical examples carefully.
Compare the pattern signals with actual PSX historical price charts.
Combine pattern analysis with volume data; rising volume often confirms patterns.
Test your understanding by paper trading or using a demo account on platforms like PSX’s official or approved brokers.
Overall, reliable PDF resources provide a structured learning path to master chart patterns, boosting confidence for smarter trading in Pakistan’s dynamic markets.
Trading chart patterns are visual shapes formed by price movements on financial charts. They help traders make sense of market behaviour by highlighting trends, reversals, or pauses. For Pakistani traders, understanding these patterns is vital since markets like the Pakistan Stock Exchange (PSX) often move in ways that reflect both local economic factors and global influences. Grasping these patterns can improve decision-making and help manage risk more effectively.
Chart patterns are recurring formations created by the price action of a security or commodity over time. They serve as indicators of potential future movements, enabling traders to anticipate where prices are likely to head next. The goal is to identify these formations early enough to position trades advantageously.
For example, a "double bottom" pattern suggests that a price decline is likely to reverse upwards, signalling a buying opportunity. Conversely, a "head and shoulders" pattern warns of a potential downtrend after a bullish run, suggesting caution or an exit point.
Chart patterns mirror the collective psychology of investors and traders—fear, greed, hesitation, and confidence all leave marks on price charts. For instance, a triangle pattern frequently occurs when buyers and sellers reach a temporary stalemate, awaiting new triggers to break the deadlock.
When a breakout happens from this pattern, it often reflects a sudden shift in sentiment, such as increased buying interest after positive economic news. Thus understanding these patterns means reading the market’s mood, especially during sensitive times like post-budget announcements or geopolitical events impacting Pakistan’s economy.
Recognising chart patterns helps predict whether a price will trend higher, reverse, or consolidate. This foresight can save Pakistani traders from entering trades that move against them and guide them towards setups with better risk-reward ratios.
For example, a trader spotting a bullish flag pattern on a PSX stock like OGDC (Oil and Gas Development Company Limited) might anticipate continuation of the upward movement after a brief pause. This gives a strategic edge compared to trading solely on gut feeling or news flow.
Chart patterns also assist in precisely timing when to enter or exit a trade. Rather than buying or selling randomly, traders can use breakouts or breakdowns from patterns as signals.
An example is waiting for a breakout from a resistance line in a symmetric triangle before buying. If a trader buys too early, the price may dip further; too late, and profits shrink. In local markets where volatility can spike suddenly, such timing is key to maximising gains and minimising losses.
Being able to read and apply chart patterns builds confidence and discipline, helping you trade more systematically rather than emotionally.
By learning to spot reliable chart patterns, Pakistani traders can navigate the complexities of dynamic markets like forex, commodities, and equities with greater clarity and control.
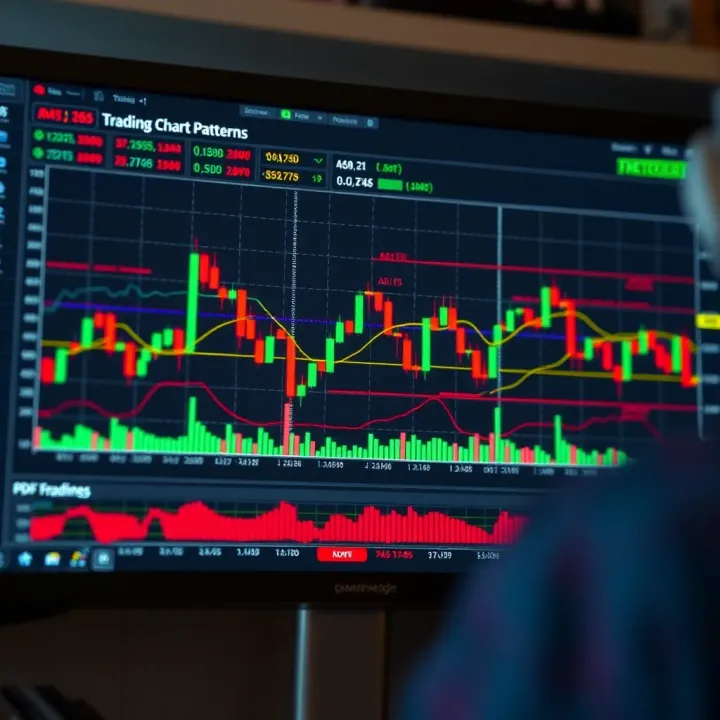
Understanding common trading chart patterns gives Pakistani traders a real edge in predicting price moves and timing their trades better. These patterns reflect recurring behaviours in the market crowd, helping traders spot when a trend might reverse or continue. Rather than guesswork, recognising these shapes on charts offers more evidence-backed decisions.
This pattern signals a likely change in trend. It looks like three peaks: a higher middle peak (the head) flanked by two smaller shoulders. When the price breaks below the neck line connecting the shoulders, it often signals a bearish reversal from an uptrend to a downtrend. For example, on the Pakistan Stock Exchange (PSX), spotting this pattern in a blue-chip stock like Habib Bank Limited (HBL) might warn traders to sell or short before prices drop. The reverse, called an inverse Head and Shoulders, shows a potential bullish reversal after a downtrend.
These patterns mark strong resistance or support levels. A double top appears as two peaks at similar price levels, suggesting price is struggling to go higher. When prices fall below the valley between tops, it confirms a reversal downwards. Conversely, a double bottom has two troughs indicating support and potential price rebound. Traders often watch these patterns to exit losing positions early or enter at better points. For instance, a double bottom in a commodity chart like petrol futures traded on Pakistan Mercantile Exchange (PMEX) could indicate a price rise.
Triangles signal that the current trend may continue. Ascending triangles have a flat top and rising bottom, often preceding an upward breakout. Descending triangles, with a flat bottom and descending top, show pressure to break lower. Symmetrical triangles have converging prices, showing indecision before the price picks a direction. Traders use these patterns across forex pairs like USD/PKR or indices on PSX to predict continuation. For example, an ascending triangle forming on the KSE-100 index can hint at more gains ahead, encouraging buying.
These short-term patterns form after strong price moves, resembling small rectangles (flags) or tiny symmetrical triangles (pennants). They represent brief pauses before the trend resumes. Recognising these helps traders avoid premature exits. In Pakistan’s volatile forex market, spotting a flag on the USD/PKR chart could signal another leg up or down, guiding timely entries.
This bullish pattern looks like a rounded cup followed by a slight pullback (handle). It suggests consolidation before prices break higher. Ideal for traders seeking strong upward moves, it appears on longer timeframes. For example, a cup and handle pattern in the stock chart of Engro Corporation could hint at sustainable gains after a period of stability.
Rounded bottoms show gradual bullish reversals after prices have fallen for some time. Likewise, rounded tops suggest slow build-up to bearish reversals. These patterns help traders identify slow but steady shifts in market sentiment rather than sudden spikes. In commodities like sugar futures, observing a rounded bottom might prompt traders to buy ahead of a steady climb.
Recognising these common chart patterns empowers traders in Pakistan’s markets to align their strategies with market psychology and price behaviour. Practice spotting these patterns on local trading platforms like PSX or PMEX to improve your timing and confidence in trades.
Reading chart patterns accurately can make a real difference in trading success. This skill helps you anticipate price moves, avoid costly errors, and time your trades better. In the Pakistani markets, where volatility and sudden economic changes play big roles, recognising genuine patterns on your trading platform becomes vital.
Candlestick charts offer rich detail compared to basic line charts. Each candle shows the open, close, high and low prices within a specific period, giving a clear picture of market sentiment. For example, a series of long-bodied green candles indicates buying pressure, helping confirm a pattern like an ascending triangle. Pakistani traders often use platforms like TradingView or MetaTrader, where candlestick charts are standard and provide the granularity needed to spot subtle reversals or continuation signs.
Volume is the unsung hero when it comes to validating chart patterns. A breakout with high volume tends to be more trustworthy, signalling strong trader interest behind the move. Suppose you spot a double bottom on the Pakistan Stock Exchange (PSX) chart; if volume spikes at the second bottom, that suggests buyers are stepping in, increasing the chance of a price rise. Ignoring volume can lead to false signals, resulting in premature entries or exits.
Different trading styles call for looking at various time frames. Day traders might focus on 15-minute or hourly charts, while swing traders use daily or weekly charts. Patterns that appear on higher time frames, such as the daily, generally carry more weight. For instance, a head and shoulders pattern on a weekly PSX chart tends to predict a more sustained move than the same on a 5-minute chart. Understanding which time frame aligns with your trading strategy helps avoid noise and misinterpretation.
False breakouts are common traps that lure traders into quick losses. They occur when price moves beyond a pattern boundary but then reverses sharply. In Pakistan’s forex or stock markets, these can happen during moments of low liquidity or after major news announcements like SBP monetary policy changes. To avoid getting fooled, wait for confirmation such as a candle close beyond the breakout level or volume support before acting.
Chart patterns alone don’t tell the whole story. Economic news, political developments, and local market holidays can heavily influence prices. For example, a bullish pennant pattern forming around the Ramazan period might behave differently due to lower trading volumes. Paying attention to the broader market situation alongside pattern analysis provides a clearer picture and prevents mistakes often caused by blind pattern recognition.
Correctly reading and interpreting chart patterns is part art, part science. It requires practice, patience, and considering multiple factors for informed trading decisions.
Accessing free PDF resources on trading chart patterns gives Pakistani traders an advantage in understanding market trends without incurring extra costs. These PDFs often come with detailed illustrations and explanations that break down complex chart patterns into manageable sections, making learning easier. For many traders, especially beginners or those cautious about investing heavily in educational materials, downloadable PDFs offer flexibility to study at their own pace.
Official trading websites often provide the most reliable and up-to-date PDF guides. For example, the Pakistan Stock Exchange (PSX) or major brokerage firms like AKD Securities and Arif Habib offer educational content tailored to Pakistan’s market climate. These sources ensure the information aligns with current trading conditions, regulations, and typical market behaviour seen on local exchanges. PDFs from these sites usually contain region-specific insights, which helps traders avoid the generic advice often found on international platforms.
Educational platforms relevant to Pakistani markets play a key role too. Websites focused on financial education, such as Invest Jolly and Profit by Pakistan Today, regularly share PDFs that explain chart patterns with examples from the PSX or Forex markets popular among Pakistani investors. These platforms often complement the PDFs with videos or tutorials, providing a fuller learning experience. They serve traders looking to combine theoretical knowledge with real-world applicability.
Organising study materials is essential to making progress with PDF guides. Start by categorising PDFs based on pattern types like reversal or continuation. Use folders on your computer or even printed copies in binders organised by topic and difficulty. This method helps build a structured learning path and makes it easier to revisit specific concepts before trading sessions. Regular review of notes and highlighting important parts boosts retention.
Practising with real charts is where theory meets action. After studying a pattern in a PDF, open charts from your trading platform—such as from PSX’s official data feeds or MetaTrader for Forex—and try spotting those patterns live or on historical data. This practice sharpens your eye for recognising patterns quickly and applying entry or exit signals effectively. Gradually, you will gain confidence in integrating chart pattern recognition into your trading decisions, improving your timing and potentially enhancing profitability.
Free PDFs provide a practical bridge between learning and doing, allowing Pakistani traders to access quality training without financial burden and then apply that knowledge directly on their preferred platforms.
Using chart patterns in the context of Pakistan’s financial markets can significantly improve trading decisions. These patterns help traders anticipate price movements, making it easier to identify entry and exit points. Given the country’s unique economic landscape and market behaviour, applying chart patterns thoughtfully is key to success.
The PSX reflects a mix of local economic factors, political developments, and investor sentiment, making chart patterns particularly relevant. Traders can use patterns like the head and shoulders or double bottoms on PSX-listed stocks to spot potential trend reversals, which often align with quarterly earnings reports or changes in government policy. For example, a breakout from a triangle pattern on a blue-chip stock like OGDC could signal a shift in momentum ahead of its dividend announcement.
Since PSX experiences volatility due to external factors such as geopolitical events or currency fluctuations, combining chart patterns with volume analysis can offer more reliable signals. It's also sensible to monitor different time frames, like daily and weekly charts, to get a fuller picture before taking positions.
Pakistan's forex market is influenced heavily by the rupee’s exchange rate against the US dollar and other major currencies like the rupee-euro pair. Chart patterns provide essential visual cues to anticipate movements amid these fluctuations. For instance, a descending triangle on the USD/PKR chart may indicate ongoing pressure on the rupee during times of economic uncertainty or rising import bills.
In commodities — especially gold, oil, and wheat — Pakistanis often follow international price trends. Patterns such as flags and pennants are useful to confirm continuation trends after sharp price moves. Knowing these patterns assists traders in timing their buy or sell decisions to manage risks while navigating globally-linked price shifts.
Local economic events like SBP monetary policy announcements, budget declarations, and inflation data have immediate effects on market prices. Chart patterns must be interpreted alongside these events to avoid false signals. For example, a head and shoulders pattern forming around the time of an SBP interest rate decision might fail or confirm based on the policy's alignment with market expectations.
Traders should also stay alert during political developments or changes in government regulations, as these can cause rapid swings. Being aware of the Pakistan federal budget timelines or major announcements by the Federal Board of Revenue (FBR) can help contextualise chart patterns more effectively.
While chart patterns provide visual forecasts, pairing them with other tools strengthens trade decisions. Incorporating indicators like the Relative Strength Index (RSI) or moving averages helps confirm the strength or weakness behind the pattern’s signal. For example, spotting a bullish cup and handle pattern on a PSX stock alongside an oversold RSI adds confidence to a potential upward move.
Fundamental analysis also complements technical patterns. Understanding company earnings, sector-specific developments, or forex reserves data adds layers to the trading strategy. This combined approach works particularly well in Pakistan’s markets, where external and internal factors frequently intertwine.
Applying chart patterns together with an understanding of Pakistan’s market nuances and economic events makes trading more precise, reducing guesswork and improving outcomes.
This practical method enables Pakistani traders to navigate local and international market complexities while making smarter, informed decisions backed by technical and fundamental insights.
📊 Explore key chart patterns traders use to read market trends effectively. Learn types, traits, and what they signal to sharpen your trading skills today.
📊 Explore essential chart patterns in detailed PDFs for smarter trading decisions. Find reliable resources and master technical analysis today! 📈

Learn to spot bearish chart patterns 📉 with clear signs of market weakness. Understand their traits and apply them to improve your trading in Pakistan's markets.

📱 Find the best trading app in Pakistan with tips on features, security, costs, and regulations. Perfect for new and experienced investors alike! 💹
Based on 11 reviews