
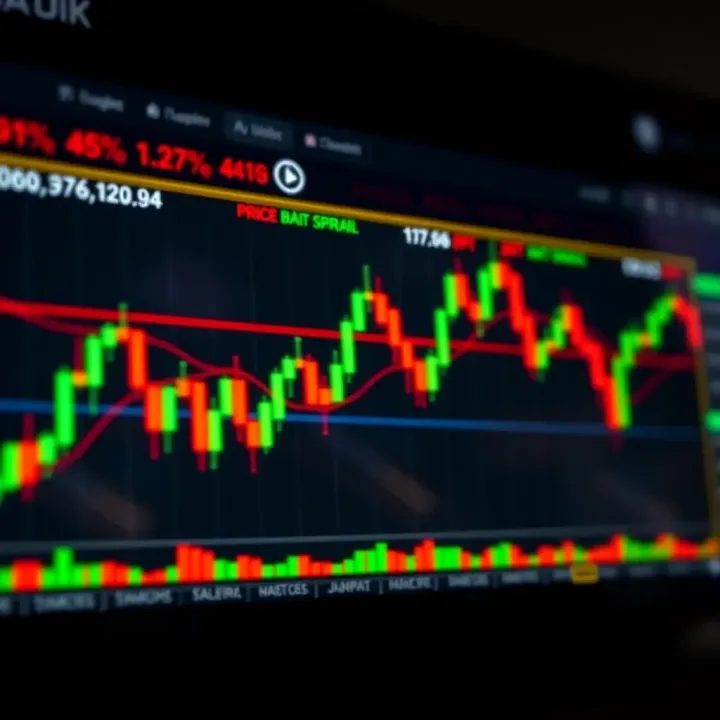
Understanding Key Candlestick Patterns in Trading
📊 Master candlestick patterns in trading to read market trends clearly! Learn to spot bullish, bearish, reversal, and continuation signals to trade smarter.
Edited By
Emily Carter
Crypto chart patterns are visual formations on price charts that traders use to interpret market behaviour. For those investing or trading in cryptocurrencies like Bitcoin, Ethereum, or local tokens on Pakistani exchanges, understanding these patterns can sharpen decision-making. Essentially, they help predict whether a price will rise, fall, or pause, especially in volatile markets.
These patterns fall into three groups: trend continuation, trend reversal, and consolidation. Each gives clues about future price moves. For example, a continuation pattern suggests the current trend will likely keep going, while reversal patterns hint at turning points. Consolidation patterns show areas where price is stabilising before a fresh move.

Recognising chart patterns isn’t just academic—it has real value. In Pakistan’s crypto zones, where sudden regulatory news or foreign investment flows can spike volatility, identifying these patterns allows traders to act quickly. Suppose a trader spots a "head and shoulders" pattern signalling a potential drop after a price rally. Selling the asset early may save losses or provide chances to buy back lower.
Using crypto chart patterns effectively means combining them with volume data and market context. Just seeing a triangle or flag isn’t enough. One must check trading volume during the pattern and broader market signals to confirm the setup.
Clear, timely analysis of crypto chart patterns can reduce guesswork and elevate trading from luck to skill.
In this article, we’ll explore notable crypto chart patterns common to Pakistani trading platforms. You'll get practical tips on spotting them and what these patterns usually indicate about price direction. This knowledge helps you approach the crypto market smarter and more confidently.
Crypto chart patterns form the backbone of technical analysis, providing traders with visual cues to assess market sentiment and possible price moves. Understanding these patterns helps traders spot trends early, avoid costly mistakes, and improve timing for entries and exits. For example, recognising a classic "head and shoulders" pattern on Bitcoin charts can signal a potential reversal, alerting traders to protect profits or take a short position.
Crypto chart patterns are specific formations created by price movements on a candlestick or line chart. They represent the collective behaviour of market participants, reflecting supply and demand dynamics in the crypto market. Patterns like flags, triangles, or double tops offer insights into whether a cryptocurrency is likely to continue its trend or reverse direction. Think of these patterns as road signs on the price journey, helping you anticipate what comes next before it happens.
Cryptocurrency markets are known for sharp price swings and high volatility. Chart patterns translate this noise into actionable trends. They help traders avoid guesswork by providing evidence-based signals rooted in past behaviour. For instance, during the 2021 bull run, traders used ascending triangles on Ethereum charts to confirm strong buying pressure, allowing them to enter positions with confidence. Ignoring these visual signals often results in missing out on profitable moves or falling victim to sudden drop-offs.
Reading chart patterns is not about finding certainty but increasing the odds in your favour. Patterns offer a clearer narrative amid crypto market chaos.
Analysing crypto chart patterns requires the right tools and timeframe selection. Most traders use charting platforms like TradingView, Binance, or Coinigy because they offer a wide array of technical indicators and drawing tools essential for spotting patterns accurately. Timeframes matter too; shorter intervals such as 15-minute or 1-hour charts suit intraday traders aiming for quick moves, while daily or weekly charts serve longer-term investors focusing on bigger trends. Combining multiple timeframes can provide a broader perspective, improving decision-making.
By focusing on these key areas of crypto chart patterns, traders in Pakistan and beyond can navigate the market more strategically, turning visual cues into profitable moves and better risk control.
Trend continuation patterns signal a temporary pause in the existing price trend before the market resumes its movement. Recognising these patterns helps traders avoid unnecessary exits and confidently hold their positions during minor pullbacks, which is especially useful in the volatile world of cryptocurrency trading. Understanding these patterns supports better timing for entries and exits, reducing emotional reactions to short-term fluctuations.
Flags and pennants usually appear after a strong price move, representing brief consolidation before the trend continues. A flag looks like a small rectangle slanting against the current trend, formed by parallel support and resistance lines. Pennants, on the other hand, are small symmetrical triangles where price action narrows. For example, Bitcoin may surge from Rs 6 lakh to Rs 7 lakh, then enter a flag pattern as buyers catch their breath. Once the flag breaks, the rally often resumes. Traders typically wait for a breakout with rising volume to confirm these patterns.

Triangles show varying pressure between buyers and sellers, often forecasting a continuation. An ascending triangle forms with a horizontal resistance and rising support line, indicating buyers gaining strength. In descending triangles, support is flat while resistance slopes down, showing sellers pressing to push prices lower. Symmetrical triangles feature converging trendlines that compress price action. All three suggest an eventual breakout. For instance, an ascending triangle on Ethereum’s chart hints that a break above resistance might rally prices further, while a descending triangle warns of a possible drop if support fails. Volume patterns during these formations offer important clues about the breakout direction.
Rectangles occur when price moves sideways between clear support and resistance levels, displaying a balance of supply and demand. Channels are similar but incline either upward or downward. These patterns reveal periods where the market digests gains or losses before continuing the trend. For example, Litecoin trading between Rs 12,000 and Rs 13,000 over several days forms a rectangle, and breaking either limit signals the next move. Channels make it easier to set entry and exit points, as traders buy near support and sell near resistance within the channel until a breakout occurs.
Identifying trend continuation patterns like flags, triangles, and rectangles can give traders an edge. Waiting for breakout confirmation and volume support reduces false signals and improves trade success.
Mastering these patterns supports better decision-making in the rapidly shifting crypto markets of Pakistan and beyond. Keep an eye on volume and price action within these formations to catch reliable continuation moves.
Recognising key reversal patterns is essential for traders who want to spot market turning points before they happen. These patterns signal shifts in market sentiment, from bullish to bearish or vice versa, offering an opportunity to enter or exit trades strategically. In crypto markets, which tend to be volatile and prone to sudden changes, identifying these reversal signals gives you a vital edge.
The Head and Shoulders pattern is a classic sign of a market top or bottom. It consists of three peaks: the middle one (head) being higher than the other two (shoulders). A neckline connects the low points in the pattern. When price breaks below the neckline after forming the right shoulder, it typically indicates a bearish reversal. For example, if Bitcoin is climbing steadily and then forms a head and shoulders on the daily chart, a break below the neckline suggests the uptrend is fading and a downtrend may follow.
The inverse head and shoulders pattern works the opposite way, signalling a bullish reversal after a downtrend. Traders often watch volume closely here; volume tends to decrease during the formation of the pattern and surge when the breakout occurs, confirming the reversal.
Double tops and bottoms are simpler but effective reversal patterns. A double top forms after an advance when price attempts to cross a resistance level twice but fails both times, creating two distinct peaks. This often results in a trend reversal to the downside. Conversely, a double bottom forms after a decline; price hits a support level twice, failing to break lower, which signals a potential bullish reversal.
For instance, imagine Ethereum struggling to break Rs 150,000 twice in a week and then falling sharply below Rs 140,000. That double top formation may encourage traders to short or exit long positions. On the flip side, if Ethereum touches Rs 120,000 twice without falling further and then rallies, that double bottom could signal buying opportunities.
Triple tops and bottoms are like extended versions of double patterns, where price tests resistance or support three times. These patterns are less common but tend to carry stronger signals. A triple top can be a warning that a strong resistance zone is in place and repeating failed attempts hint at a downward reversal. Likewise, a triple bottom suggests a solid support level, often followed by a rally.
Consider a scenario where Litecoin tests Rs 18,000 resistance three times over a month but can't break through, then falls sharply. This triple top warns traders about a potential bearish phase. Similarly, a triple bottom at Rs 15,000 suggests strong buying interest, making it less risky to buy near this level.
Accurately identifying these reversal patterns requires practice and confirmation from other indicators such as volume, RSI, or moving averages. Using them in combination improves the chance of timing entries and exits more profitably in Pakistan's fast-moving crypto markets.
Mastering these key reversal patterns equips you with practical signals to anticipate and react to market shifts, improving your overall trading results.
Consolidation patterns mark periods where the price of a cryptocurrency moves within a tight range, reflecting a temporary pause in market momentum. These phases are important because they signal indecision among traders before a potential continuation or reversal of the trend. Recognising consolidation helps traders avoid false breakouts and plan entries or exits with more precision.
Rectangular consolidation zones occur when price action oscillates between parallel support and resistance levels without establishing a clear direction. In crypto markets, these zones often develop after strong moves, pausing before the next leg. For example, Bitcoin may trade between Rs 5,000,000 and Rs 5,200,000 for days before deciding on the next move. Trading within such rectangles requires patience; typically, traders wait for a confirmed breakout above resistance or breakdown below support before taking positions.
Key points to remember:
Volume usually declines during consolidation and spikes on breakouts.
False breakouts are common, so confirmation through close prices or volume helps.
Stop losses placed just outside the consolidation boundaries reduce risk.
The cup and handle pattern is a bullish continuation pattern, shaped like a curved bowl (the cup) followed by a smaller dip (the handle). This formation suggests that the market tested support, recovered steadily, and then paused briefly before continuing upward. In the Pakistani crypto market, one might spot BTC forming a rounded bottom (the cup) over several weeks, followed by a narrow sideways move creating the handle.
Traders often take buy signals when price breaks above the handle's resistance with increased volume. This pattern is reliable because it reflects traders’ confidence returning gradually.
The rounding bottom, or saucer bottom, indicates a gradual shift from a downtrend to an uptrend through a wide, smooth curve. Unlike sharp reversals, it shows a slow recovery that builds a strong base. Ethereum, for instance, may show this pattern after months of decline, signalling the market’s hesitation to push prices lower.
This pattern provides a strong entry point for traders looking to catch emerging bullish momentum. Patience is key here since the shape forms over a longer period, but once established, it often precedes sustained gains.
Understanding consolidation patterns equips you to better gauge market pauses and potential breakouts, helping avoid hasty decisions in volatile crypto trading environments.
Recognising these consolidation patterns allows traders to align strategies with market rhythm, improving timing and confidence in entries and exits. It’s wise to combine pattern signals with volume analysis and other indicators to confirm the market’s next move before committing capital.
Using chart patterns effectively can sharpen your trading edge in the volatile crypto market. These patterns are not just shapes on the chart; they help you anticipate price moves, identify potential breakout or reversal points, and manage trades with more confidence. For traders in Pakistan, where cryptocurrency markets swing sharply, pattern application offers practical guidance amid uncertainty.
Volume is often the silent partner in chart pattern analysis. A pattern alone may look convincing, but strong volume during breakouts or breakdowns confirms genuine market interest. For instance, an ascending triangle breaking upwards with rising volume typically signals a reliable bullish move. On the flip side, weak volume during a breakout might suggest a false alarm.
Indicators like the Relative Strength Index (RSI) or Moving Average Convergence Divergence (MACD) can add layers to your confirmation. RSI divergence can warn of weakening momentum even if a pattern looks bullish. Combining volume data and indicators helps weed out fakeouts and refines timing.
Chart patterns give shape to potential entry and exit points, which is crucial for disciplined trading. When a breakout from a symmetrical triangle happens, entering just above the breakout level can minimise risk. Stop-loss orders are often placed just below the nearest pattern support or resistance to limit downside.
Take the cup and handle pattern, for example. Once the price breaks above the handle's resistance, entry becomes clearer. Targets often come from measuring the cup’s depth and projecting it upwards. This method offers clear risk-to-reward ratios, a must for prudent traders.
Pattern analysis isn't only about profit—it also helps manage risk. Failure of a pattern, such as a false breakout, should trigger exits to protect capital. Using patterns to set stop-loss levels, based on recent lows or highs, provides a systematic approach to risk.
Additionally, knowing when a pattern loses validity prevents holding onto losing trades. Proper position sizing combined with pattern-based stop losses ensures you don't risk more than you can afford to lose. This disciplined approach is key in crypto markets known for sudden reversals.
Well-applied chart pattern analysis provides a roadmap. It guides entry points, exit strategies, and risk limits, which helps traders navigate crypto volatility with greater control.
In sum, applying chart patterns in your trading strategy means using them alongside volume and indicators for confirmation, choosing entry and exit levels smartly, and managing risks with clear stops. This approach builds a practical framework that serves both newcomers and experienced traders in Pakistan’s crypto landscape.
📊 Master candlestick patterns in trading to read market trends clearly! Learn to spot bullish, bearish, reversal, and continuation signals to trade smarter.

📊 Explore key chart patterns traders use to read market trends effectively. Learn types, traits, and what they signal to sharpen your trading skills today.

📈 Learn how forex chart patterns reveal price trends, helping Pakistani traders make smarter entry and exit calls for better trading success in local markets.

Learn to spot bearish chart patterns 📉 with clear signs of market weakness. Understand their traits and apply them to improve your trading in Pakistan's markets.
Based on 13 reviews