
Understanding Key Chart Patterns with PDF Guides
📊 Discover 7 key chart patterns for technical analysis with practical examples and PDF guides, tailored for traders in Pakistan looking to boost skills.
Edited By
Matthew Reed
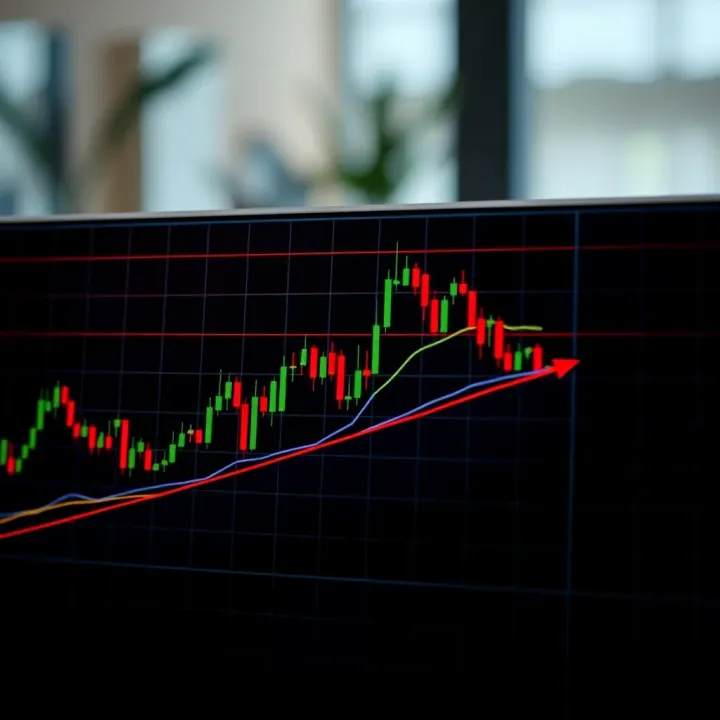
Forex chart patterns are visual formations created by price movements on a forex chart. They often signal potential trend continuations or reversals, helping traders predict future price behaviour. For Pakistani traders, understanding these patterns offers an edge in deciding when to enter or exit trades, potentially boosting profitability.
Recognising chart patterns involves observing how price waves oscillate between support and resistance levels over time. Common patterns include flags, triangles, head and shoulders, and double tops or bottoms. Each pattern has a distinct shape and implication; for example, a triangle typically indicates price consolidation before a breakout.

Recognising these patterns early can improve timing, allowing traders to avoid false moves and reduce risk exposure in volatile markets like Pakistan’s forex scene.
Here’s why understanding forex chart patterns matters:
Predicts Market Sentiment: Patterns reflect buyer and seller behaviour, indicating whether bulls or bears are gaining control.
Guides Entry and Exit Points: Knowing when a trend may reverse lets you open or close positions more effectively.
Supports Risk Management: Patterns often indicate stop-loss and take-profit levels, helping protect your capital.
In Pakistan’s forex trading environment, where currency pairs such as USD/PKR face sharp movements due to economic news or SBP policy changes, chart patterns can act as a reliable guide amid uncertainty.
Learning to identify these formations requires practice and discipline. It also involves combining patterns with other tools like volume indicators or moving averages for confirmation.
The next sections will break down key forex chart patterns used by traders worldwide and discuss how you can apply them to local currency pairs and trading conditions.
Understanding forex chart patterns is essential for any serious trader, especially in Pakistan’s forex market where currency fluctuations can be quite volatile. These patterns, visible on price charts, reflect the collective psychology of traders and investors. Recognising them helps you anticipate possible price moves, guiding your entry and exit points more confidently than relying solely on indicators or news.
Forex chart patterns are shapes and formations that occur on price charts based on past price action. They emerge from the natural ebb and flow of buying and selling pressures in the market. Patterns like triangles, head and shoulders, and double tops/bottoms indicate potential trend reversals or continuations. For example, a rising wedge pattern might signal an upcoming price drop, giving you a heads-up to adjust your trades.
These patterns are not random; they often repeat because human behaviour in financial markets tends to follow similar cycles of fear, greed, and hesitation. In the Pakistani forex market, this behaviour can be influenced by local economic events, government policies, or changes in the rupee’s value against the dollar or other currencies.
Chart patterns give traders a visual tool to interpret market sentiment, which is crucial for making smarter trading decisions. Unlike pure technical indicators that rely on mathematical calculations, patterns provide context based on price action itself. This context can alert you to potential breakouts, reversals, or pauses in trends.
For instance, during periods when the Pakistan Rupee faces pressure due to economic uncertainty, chart patterns can help spot when the momentum might be shifting before the news becomes widespread. Traders who act quickly on these patterns can avoid losses or capitalise on short-term price swings.
Recognising forex chart patterns helps you cut through market noise and focus on price behaviour, which is often the most reliable guide in uncertain trading environments.
In summary, learning to identify and understand forex chart patterns equips you with a practical edge. They complement other analysis tools and adapt well to Pakistan’s unique market dynamics, making your trading approach more informed and less speculative.
Understanding common bullish and bearish chart patterns is essential for any trader who wants to make smarter decisions in the forex market. These patterns act as road signs, signalling potential price directions and helping traders decide when to enter or exit. For example, recognising a bearish pattern could stop you from buying a currency pair just before it dips, saving significant losses.

The head and shoulders pattern is one of the most reliable indicators of trend reversal. It consists of three peaks: a higher peak (the head) flanked by two lower peaks (the shoulders). For instance, if the price of USD/PKR rises to a peak, falls, climbs even higher, and then falls again but doesn’t reach the previous high, it forms this pattern. Spotting it requires paying attention to these peaks forming over a certain period rather than isolated price spikes.
This pattern signals a shift from bullish to bearish trend or vice versa, depending on its orientation. A head and shoulders top suggests an uptrend is ending, and prices may fall. Traders often watch for the “neckline” break—a key support level—before making their move. Ignoring this can lead to entering trades right before a reversal, which may result in losses.
Double tops and double bottoms show potential trend reversals through price testing a support or resistance level twice without breaking it. A double top looks like an 'M', signalling that an uptrend might reverse after failing to breach resistance twice. Conversely, a double bottom resembles a 'W' and hints at a decline turning bullish after two failed attempts to drop lower.
Traders usually wait for confirmation—like the price crossing below the trough between two peaks in double tops—before acting. In the Pakistani forex market, where sudden economic news may cause sharp moves, waiting for this confirmation avoids false signals. For example, if PKR/USD shows a double bottom during a period of political stability, it may signal a good buy opportunity after a confirmed breakout.
Triangles form when price moves become increasingly tight, creating converging trendlines. An ascending triangle has a flat resistance with higher lows, suggesting buyers are gaining strength. Descending triangles are upside down, showing sellers gaining upper hand. Symmetrical triangles have both lines converging equally, signaling indecision.
The breakout direction usually follows the prevailing trend, but sideways breakouts also occur. An ascending triangle often breaks upward, indicating continuation of uptrend, while a descending triangle tends to break downward. Symmetrical triangles require traders to watch for breakout confirmation before taking a position, as the price can swing either way. Pakistani traders benefit by combining triangle patterns with indicators like RSI to weigh momentum before acting.
Recognising these chart patterns clearly can save you from jumping into trades blindly and help you make more measured decisions based on price behaviour, especially in a market as volatile as forex.
Continuation patterns signal the likely resumption of an ongoing trend after a brief pause or consolidation. These formations allow traders to spot moments when the market catches its breath before pushing in the same direction. Recognising continuation patterns can help you avoid premature exits and better time your trades during trending markets.
Formation and Trading Implications
Flags and pennants form after a strong price move, usually a sharp rally or decline. A flag looks like a small rectangle slanting against the trend direction, whereas a pennant resembles a tiny symmetrical triangle. Both occur as price consolidates in a narrow range, reflecting a short pause. When volume drops during the formation and then surges on the breakout, it usually confirms that the previous trend will continue. For example, in the Pakistani forex market, if the US Dollar rises strongly against the Pakistani Rupee to Rs 280 and then forms a flag on daily charts, a breakout above the flag's upper boundary likely signals the uptrend will carry on.
Typical Duration
Flags and pennants usually last from a few hours to a few days on shorter time frames, making them popular among intraday and swing traders. Their brief formation means they can offer quick trading signals without waiting long. However, on higher time frames like daily or weekly charts, these patterns might extend longer. In fast-moving forex pairs, such as USD/PKR during high volatility periods influenced by economic news or central bank decisions, these patterns can help spot continuation moves that might unfold within days.
How to Spot Them
Rectangles appear when price moves sideways between parallel support and resistance levels, creating a box-like shape. Channels are like rectangles but with support and resistance lines sloping up or down. Both show the market consolidating but within defined boundaries. Spotting these involves identifying multiple touches of support and resistance without breakouts. A USD/PKR pair trading between Rs 280 and Rs 282 for several sessions forms a rectangle. Channels add a dynamic angle, like during a gradual uptrend where price moves between two rising parallel lines.
Using Them to Confirm Trends
Rectangles and channels help confirm whether a trend is pausing or reversing. A breakout above or below these formations signals a continuation or reversal respectively. Traders use volume spikes at breakouts for confirmation. Within Pakistani trading scenarios, spotting a bullish ascending channel amid a strengthening Rupee suggests momentum is steady. Conversely, failing to break a rectangle's resistance multiple times might hint at weakening trend strength, helping traders adjust their positions accordingly.
Identifying and trading continuation patterns allow you to stick with powerful trends and avoid unnecessary exits during minor corrections, boosting your chances of consistent profits.
By recognising flags, pennants, rectangles, and channels on your forex charts, you can better understand market pauses and prepare for the next move in Pakistan's dynamic currency market.
Forex chart patterns offer solid clues about price trends, but applying them in Pakistan's forex market needs extra care due to local factors. Pakistani traders face unique challenges like rupee volatility influenced by currency reserves, trade deficits, and political developments. Using these patterns smartly can help manage risks and spot opportunities during sudden market moves.
Impact of Rupee Fluctuations
The Pakistani rupee (PKR) often experiences sharp swings caused by shifts in foreign exchange reserves, remittances, or macroeconomic policies. For example, during a sudden devaluation announced by the State Bank of Pakistan (SBP), chart patterns like flags or pennants may rapidly form and break, reflecting panic selling or buying interest. Traders should expect higher volatility, meaning chart patterns might develop and resolve faster than in stable markets. Hence, confirming a pattern with volume or additional indicators becomes crucial.
Effect of Economic Events
Economic events such as SBP monetary policy decisions, IMF reviews, or major political announcements directly impact forex trends in Pakistan. For instance, before an anticipated hike in the policy rate, double-top patterns may signal a weakening rupee as traders speculate on capital outflows. Recognising how these events interact with chart patterns helps traders avoid false breakouts. It also allows them to time entries better around key news releases that often cause sharp reversals or trend confirmations.
Role of Indicators like RSI and MACD
Chart patterns gain strength when paired with momentum indicators such as the Relative Strength Index (RSI) and Moving Average Convergence Divergence (MACD). The RSI helps spot overbought or oversold situations. For example, an ascending triangle pattern confirming with RSI rising but nearing 70 suggests strong buying pressure but warns of possible correction. MACD crossovers alongside a pennant breakout can provide additional confirmation of trend continuation. Such combinations increase confidence in trading decisions, reducing reliance on patterns alone.
Importance of Volume and Time Frames
Volume acts as an important confirmation tool in validating forex chart patterns. In Pakistan’s market, sudden surges in volume during breakout points often indicate genuine moves rather than false signals. For instance, a breakout from a rectangle pattern on higher-than-average volume tends to be more reliable. Time frame selection also affects pattern effectiveness—shorter time frames may show noise while longer time frames like daily or weekly charts offer stronger trend signals relevant for swing trades. Pakistani traders should align their chosen time frame with their trading style and risk tolerance.
Combining chart patterns with local market context and technical indicators builds a more robust strategy for forex trading in Pakistan. This layered approach helps navigate rupee fluctuations and economic uncertainties confidently.
Trading forex chart patterns can be highly rewarding, but traders often stumble on common pitfalls that can cost them dearly. Avoiding these mistakes helps you improve your timing and risk management, leading to better decision-making in Pakistan's volatile forex market. Let’s explore two key errors: false breakouts and ignoring market context.
False breakouts happen when price moves beyond a pattern’s boundary, suggesting a trend continuation or reversal, but then reverses sharply. This traps traders who enter positions prematurely. For example, a trader spots a breakout above a triangle pattern in USD/PKR and buys, only for the price to retreat below the breakout level soon after. This misjudgement can quickly wipe out profits or increase losses.
To avoid this, watch for confirmation signals like increased volume or a retest of the breakout level before entering. Using tools like the Relative Strength Index (RSI) can also help identify overbought or oversold conditions that warn of a possible fakeout. In Pakistani forex markets, where sudden central bank announcements or political developments cause spikes, false breakouts become even more prevalent. Staying patient and confirming the breakout prevents costly mistakes.
No chart pattern exists in isolation—market context matters a lot. Ignoring the broader economic backdrop or important news can lead to misguided trades. For instance, a bullish flag pattern may suggest continuation, but if the State Bank of Pakistan hikes interest rates unexpectedly, it can alter market sentiment abruptly, invalidating the pattern.
Traders should always scan Pakistan-specific economic indicators, geopolitical news, and scheduled reports such as SBP monetary policy decisions or trade balance figures. Combining chart patterns with fundamental analysis avoids getting blindsided by sudden market moves. Also, patterns that appear during major news events tend to be less reliable because of increased volatility.
Successful forex trading in Pakistan means blending technical insights from chart patterns with a clear understanding of the local economic and political landscape.
In sum, steer clear of jumping into trades on weak breakouts without confirmation. Always factor in news and market mood before trusting patterns blindly—this balanced approach improves your accuracy and protects your capital in Pakistani forex trading.
📊 Discover 7 key chart patterns for technical analysis with practical examples and PDF guides, tailored for traders in Pakistan looking to boost skills.

🔍 Looking for the best forex trading broker in Pakistan? Learn about top features, fees, platforms & support to trade confidently and securely 💼📊

Explore how to pick the best Forex trading platform in Pakistan 💹. Learn about key features, security, regulations, and tips for beginners to trade smart.
Find the ideal Forex trading platform in Pakistan 🇵🇰 with practical tips on features, security, and top choices tailored for every trader's style 📈💡
Based on 6 reviews