

Understanding Forex Chart Patterns in Trading
📈 Learn key forex chart patterns and how to decode currency movements for smarter trading in Pakistan. Get free PDF guides tailored to local market needs. 🇵🇰
Edited By
Liam Foster
Bullish candlestick patterns serve as essential tools for traders aiming to catch upward price movements in financial markets. Unlike basic trendlines or moving averages, these patterns offer clear visual cues on price action, helping to predict potential rises in stocks, forex, or commodities.
A bullish candlestick typically indicates that buyers are in control during the trading period, pushing prices higher from open to close. Recognising such patterns allows you to enter trades at favourable points, potentially increasing profits and reducing risk.

Understanding the nuances of these patterns equips you to spot trend reversals or continuations early, an advantage in fast-moving markets, especially on Pakistan Stock Exchange (PSX) or forex platforms.
Common bullish patterns include:
Hammer: A candle with a small body, long lower wick, signalling rejection of lower prices.
Bullish Engulfing: A larger green candle completely covers the previous red candle, showing a shift in momentum.
Piercing Line: The price opens lower but closes above the midpoint of the prior red candle, indicating buying pressure.
Morning Star: A three-candle pattern signalling a strong reversal from downtrend.
Each pattern has distinct implications, but none guarantees success alone. Combining candlestick analysis with volume data, support levels, and market context improves accuracy.
For Pakistani traders juggling stocks or forex, downloadable PDF guides with pattern illustrations and practical examples prove handy. These resources can be reviewed offline and help reinforce learning.
In this guide, you will find targeted tips to recognise patterns in real trading scenarios. For example, spotting a hammer near a key support level on a PSX stock may prompt a cautiously optimistic entry.
This approach, blending candlestick signals with other indicators and market understanding, fits well in Pakistan's dynamic trading environment where timely decisions matter.
By mastering bullish candlestick patterns and applying them wisely, you stand better prepared to identify upward trends and make informed trading choices.
Bullish candlestick patterns are a key tool for traders aiming to identify potential upward price moves in the market. Understanding these patterns helps you spot buying opportunities early, which is valuable for making timely decisions in fast-moving Pakistani markets like the Pakistan Stock Exchange (PSX) or forex trading. These patterns are not just random shapes; they reflect the tug of war between buyers and sellers, giving clues about market sentiment.
Each candlestick provides four critical data points: the opening price, closing price, highest price, and lowest price within a set time frame. The rectangular part of the candle is called the 'body,' which shows the range between opening and closing prices. Lines extending above and below, known as 'wicks' or 'shadows,' indicate the highest and lowest prices during the same period.
In practical terms, these details help traders quickly understand price action without crunching numbers. For example, a long body suggests strong momentum—either up or down—while long wicks might signal rejection of certain price levels. This visual simplicity is why many rely on candlestick charts over traditional line charts.
The difference between bullish and bearish candles lies in their colour and orientation. A bullish candle forms when the closing price is higher than the opening price, often displayed in green or white. This indicates buyers had control by the end of that period. In contrast, a bearish candle shows a lower closing price than the opening, signalling selling pressure, often coloured red or black.
This distinction allows traders to spot momentum shifts at a glance. For instance, spotting consecutive bullish candles on a PSX stock like Engro Corporation can hint at sustained buying interest, but traders should still confirm with other analysis tools.
Bullish patterns emerge from specific combinations of one or more candlesticks that suggest a likely rise in price. Key signals include long bullish bodies following bearish trends, engulfing moves where a bullish candle completely covers a previous bearish candle, and formations like the Morning Star that show gradual buyer strength.
These signals help traders decide when to enter a trade. For example, spotting a Bullish Engulfing pattern in Unity Foods' share chart could encourage an investor to consider buying before the price shoots up.
The psychology behind these patterns ties to trader behaviour. A bullish candle usually means buyers are gaining confidence, overpowering sellers. This shift often results from changing perceptions of company fundamentals, news, or broader economic indicators such as a favourable State Bank of Pakistan (SBP) policy announcement.
When traders see these patterns, it triggers a collective response—more buyers enter, further pushing prices upward. Understanding this behavioural feedback loop is essential, especially in Pakistan’s market, where sentiment-driven moves are common. Recognising these patterns early can help you avoid chasing the market and instead position yourself ahead of the trend.
Clear recognition of bullish candlestick patterns can improve your timing and confidence when entering trades, helping you adapt better to Pakistani market dynamics and global influences alike.
Recognising common bullish candlestick patterns is key for traders and investors aiming to catch market upswings early. Each pattern signals a potential shift in momentum that can guide entry decisions or risk management. Understanding their features helps you confirm whether a price rise is likely sustained or just a brief rally.
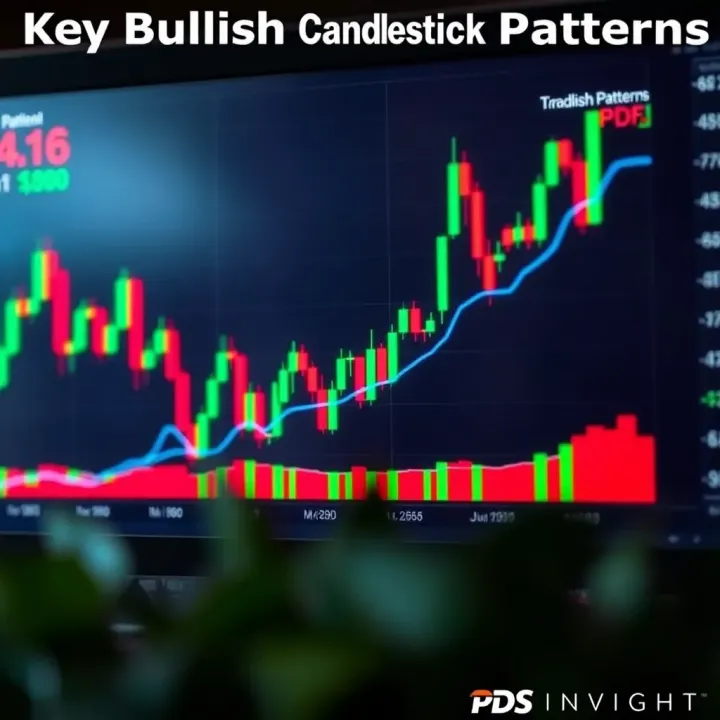
Patterns fall into two main groups: single-candle and multi-candle formations. Single-candle patterns show quick shifts, while multi-candle ones signal confirmation across sessions. Both play a role in practical trading strategies on the Pakistan Stock Exchange and forex markets.
The hammer forms when a candle has a small body near the top with a long lower wick, indicating buyers pushed prices back up after a sell-off. An inverted hammer looks like the hammer's upside-down twin, with a long upper wick and small body near the bottom. Both are signals that sellers lost control and buyers might take charge soon.
For example, if a PSX share after a downtrend prints a hammer on daily charts, it suggests support is forming and prices may rebound. Traders often wait for confirmation on the next day before entering, reducing false signals.
A long white candle represents strong buying pressure as the closing price is significantly higher than the open, creating a sizeable bullish body. Its length alone shows momentum, rather than uncertainty.
Suppose a share like Lucky Cement breaks out with a long white candle after consolidation. This reflects renewed demand and often marks the start of an uptrend or continuation. Traders use this as a signal to enter positions or hold on to existing ones.
This dual-candle pattern occurs when a small bearish candle is followed by a larger bullish candle that completely 'engulfs' the previous one's body. It shows a strong reversal where buyers overwhelm sellers.
On Pakistani market charts, spotting a bullish engulfing pattern near support levels signals a shift back to buying sentiment, making it a reliable entry cue.
The bullish harami consists of a large bearish candle followed by a smaller bullish one within the prior candle's body. It depicts hesitation in selling and potential reversal.
Though less powerful than an engulfing pattern, the harami warns traders to watch closely for further bullish confirmation before acting.
This pattern emerges when a bearish candle is succeeded by a bullish candle that opens lower but closes above the midpoint of the previous body's range. It indicates buyers are stepping in despite a negative start.
Examples from PSX may show the piercing line pattern after market dips, suggesting a bounce-back due to solid demand at lower levels.
The morning star is a three-candle pattern: a long bearish candle, a small-bodied candle (showing indecision), then a strong bullish candle closing well into the first candle’s body. This signals a clear shift from selling to buying.
Traders on Pak stocks or forex platforms regard the morning star as a solid signal to enter long positions, especially when confirmed by volume or supportive indicators like RSI.
Recognising these individual patterns alone doesn't guarantee success. Combining them with volume analysis, trend context, and confirmation tools enhances reliability in Pakistan's dynamic markets.
By mastering these common bullish candlestick patterns, you gain practical tools to read market sentiment and time entries more confidently.
Understanding how bullish candlestick patterns work in Pakistani markets is more than just spotting green candles on a chart. These patterns must be looked at alongside local market factors like trading volume, prevailing trends, and macroeconomic developments. This practical approach helps traders and investors make better decisions, rather than relying on patterns in isolation.
Using patterns alongside volume and trend analysis is essential for confirming the strength of a bullish signal. For example, a bullish engulfing pattern that appears after days of high trading volume signals genuine buying interest rather than just random price fluctuations. In Pakistan Stock Exchange (PSX), volume spikes often accompany major price movements, so watching volume helps distinguish reliable signals. Also, recognising the overall trend matters — a bullish pattern in a downtrend may indicate a potential reversal, but in an established uptrend it confirms continuation. This way, volume and trend analysis add practical layers to candlestick interpretations.
Applying SBP policy impact on market sentiment is equally important. The State Bank of Pakistan’s monetary policies influence liquidity and investor confidence, which reflect in price behaviour. After SBP announces a cut in the policy rate, bullish candlestick patterns often gain momentum as cheaper borrowing fuels buying. Conversely, a rate hike could weaken bullish signals due to tighter liquidity. Pakistani traders monitoring SBP's moves alongside candlestick patterns can better gauge if the market sentiment will support or undermine bullish trends.
Real case scenarios on PSX shares showing bullish patterns demonstrate how these signals play out locally. For instance, Hub Power Company (HUBC) exhibited a morning star pattern in early 2023, followed by a significant upward surge in price over weeks. This pattern aligned with positive quarterly earnings and rising sector confidence. Such examples confirm that recognising bullish candlesticks is practical when combined with company fundamentals and sector outlook.
Impact of local economic events also shapes how bullish patterns behave. Announcements like the federal budget, IMF programme progress, or election results can shift trading sentiment abruptly. For example, during the 2022 budget session, bullish patterns on sectors like construction and cement appeared as investors anticipated higher government spending. Awareness of such events prevents misreading patterns caused by temporary market noise.
When analysing bullish candlestick patterns in Pakistan, always blend chart signals with volume, trending direction, SBP decisions, and local economic news to improve your trading success.
By contextualising candlestick formations within Pakistan’s specific market environment, traders and investors can use these patterns with greater confidence and accuracy.
PDF resources offer a practical way to learn bullish candlestick patterns, especially for traders who prefer structured study. These documents are easy to download and save, allowing offline access where internet connectivity may be unreliable — a common issue during loadshedding in many Pakistani cities. This convenience means you can review charts, patterns, and technical explanations anytime without depending on continuous online access.
Furthermore, PDFs serve as quick reference guides during trading hours. Instead of juggling multiple browser tabs or apps, a simple, well-organised PDF can put important pattern details right at your fingertips, helping you make timely decisions on the Pakistan Stock Exchange (PSX) or forex platforms.
Visual learning is key to understanding candlestick patterns. Good PDF guides include clear charts that show the shape, size, and position of bullish candles. These visuals reduce confusion compared to text-only descriptions. Step-by-step explanations combined with annotated diagrams help break down the formation of complex patterns like the Piercing Line or Morning Star, making them easier to spot in real trading scenarios.
For example, a PDF showing a sequence of Bullish Engulfing patterns alongside volume data helps reinforce how strong buying interest manifests on price charts. Such visual aids also benefit traders who juggle multiple assets and want to quickly identify patterns without memorising dense theory.
Reliable sources for bullish candlestick pattern PDFs matter a lot. Many websites claim to offer free guides, but their accuracy and practical relevance vary. Stick with recognised Pakistani financial education portals or sites related to regulators and market authorities for trustworthy content. These sources keep their material up to date with local market conditions, Pakistani trading rules, and applicable financial events.
The Securities and Exchange Commission of Pakistan (SECP), the State Bank of Pakistan (SBP), and the Pakistan Stock Exchange all provide educational tools and downloadable PDFs. These official resources align closely with local regulatory frameworks and market realities, giving you confidence in the reliability of their trading advice and examples.
Using SECP, SBP, and PSX materials also often means access to content in both English and Urdu, which can be helpful for better comprehension. In addition, these PDFs are typically well-structured for beginners and seasoned traders alike, supporting learning at different skill levels.
Having a curated collection of PDF guides from credible Pakistani institutions enriches your trading toolkit and sharpens your ability to read bullish candlestick patterns accurately.
When adding PDFs to your learning plan, consider reviewing materials regularly and cross-referencing the patterns shown against live charts on your trading platform. This combination will reinforce learning and improve your practical skills over time.
Understanding bullish candlestick patterns is just the starting point; applying them effectively in Pakistan's market environment requires combining these patterns with other tools and managing risk carefully. These practical tips can improve accuracy and help you protect your capital in the volatile PSX or forex markets.
Integrating moving averages and the Relative Strength Index (RSI) offers a more reliable picture than relying on candlestick patterns alone. For instance, a bullish engulfing pattern appearing near the 50-day moving average can indicate stronger buying interest, especially if RSI is below 70 but rising from oversold levels. This combination confirms momentum is shifting upwards.
Confirming patterns before entry is crucial to avoid false signals common in busy markets like Pakistan's. Wait for the candle following the bullish pattern to close higher, or look for volume spikes that support the price move. For example, a morning star pattern backed by higher than average trade volume on PSX adds validity before you enter a position.
Setting stop-loss orders based on pattern signals limits potential losses. After spotting a hammer or bullish harami, placing a stop-loss just below the pattern’s low protects you if the market reverses. In Pakistan’s context, where sudden news or geopolitical events impact prices sharply, strict stops are essential to avoid heavy losses.
Also, consider limiting trades during high volatility or scheduled loadshedding days. Electricity outages can disrupt internet or trading platforms, leading to delayed order execution or missed exit points. Volatility on days of major announcements or during floods can cause erratic price swings that affect pattern reliability. So, it’s safer to reduce trading activity during such periods.
Practical trading need not be complicated; blending candlestick patterns with other indicators and managing risk thoughtfully makes all the difference, especially in Pakistan’s dynamic markets.
Use these tips consistently to enhance your decision-making, align with market rhythms, and safeguard your investment while trading bullish candlestick patterns.
📈 Learn key forex chart patterns and how to decode currency movements for smarter trading in Pakistan. Get free PDF guides tailored to local market needs. 🇵🇰

📈 Learn how strong bullish candlestick patterns signal upward price moves in trading. Understand key formations, interpretation, and integration with other indicators for smarter decisions.

📉 Learn key bearish candlestick patterns in trading, spot downtrends early, avoid common mistakes, and combine signals for smarter market decisions.
📈Explore key & advanced candlestick patterns for traders in Pakistan. Learn to spot, read & use them effectively. Plus, get helpful PDF guides for offline study! 📊
Based on 8 reviews