

Understanding Forex Chart Patterns in Pakistan
📈 Learn how forex chart patterns reveal price trends, helping Pakistani traders make smarter entry and exit calls for better trading success in local markets.
Edited By
Liam Davies
Forex chart patterns give you a window into how currency prices move over time, helping traders make sense of market behaviour and decide when to buy or sell. These patterns form from price movements on candlestick or line charts and often suggest whether a trend will continue or reverse.
Pakistani traders can greatly benefit by mastering key chart patterns such as Head and Shoulders, Double Tops and Bottoms, Triangles, and Flags. These patterns don’t just happen randomly; they reflect the collective psychology of market participants—fear, greed, hesitation—and signal possible future price action.
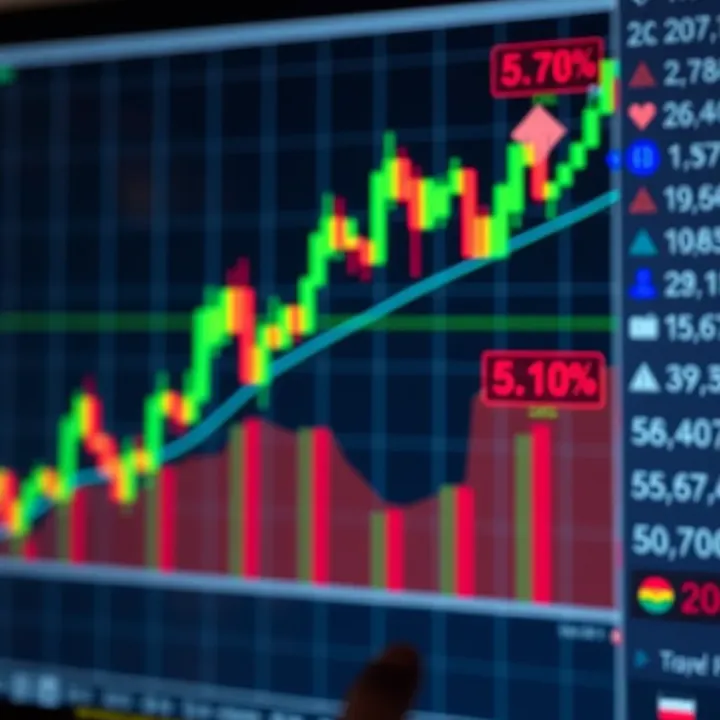
Understanding forex chart patterns helps you spot trading opportunities early and manage risks better.
Head and Shoulders: Signals a trend reversal. The pattern shows a peak (head) between two lower peaks (shoulders). When the price breaks below the neckline, it often indicates a bearish trend start.
Double Top and Double Bottom: Represent two attempts to break a price level. Double Tops suggest sellers are resisting higher prices; Double Bottoms hint buyers are defending a low.
Triangles (Ascending, Descending, Symmetrical): Indicate tightening price ranges before a potential breakout in either direction. Ascending triangles usually break upwards, descending downwards.
Flags and Pennants: Short-term continuation patterns after a sharp price move, suggesting a pause before the trend resumes.
PDF guides tailored for forex chart patterns offer concentrated knowledge, combining visual examples and step-by-step explanations. For traders in Pakistan, they provide offline reference material perfect for studying during travels or when internet access is unstable. Many local trading academies and brokerages produce free or low-cost PDFs covering these patterns with examples relevant to major pairs like USD/PKR or EUR/USD.
Forex markets are affected by global events and local factors like SBP policy changes and geopolitical tensions. Chart patterns reflect these influences but require confirmation alongside other tools such as volume analysis and economic calendars.
By learning these patterns with matched PDF resources, Pakistani traders can approach the forex market with greater confidence, spotting setups that fit their trading style whether intraday or swing trading.
Keep practising with real charts and consult credible PDF materials to sharpen your skills steadily.
Forex chart patterns are essential tools for traders and investors aiming to decode market behaviour. They visually display how prices have moved and help anticipate where they might head next. For Pakistani traders, understanding these patterns offers a practical edge, especially in a market affected by factors like rupee fluctuations and economic news.
Forex chart patterns are shaped formations on price charts that appear consistently due to the behaviour of buyers and sellers. These patterns help traders spot probable shifts in market direction or continuation trends. For example, a "Head and Shoulders" pattern might signal a coming reversal, which can signal traders to exit a long position or enter a short one. Recognising such patterns is a key skill because they turn raw price data into actionable trading signals.
Prices don’t move randomly; they reflect collective trader emotions, fears, hopes, and decisions. Chart patterns capture these sentiments. For instance, a "Double Top" pattern shows that buyers have tried twice to push prices higher but failed, indicating weakening bullish sentiment. Understanding these signals helps traders read the market’s mood and anticipate where the money flow might go next.
Chart patterns act like road signs in the forex market, guiding traders on possible future price actions. By analysing historical movements encapsulated in patterns, traders can predict likely price trends. For instance, an "Ascending Triangle" often precedes a price breakout upwards. This predictive capability allows traders to position themselves earlier and potentially gain better returns.
Entry and exit points are as important as the decision about what to trade. Using chart patterns helps sharpen this timing. For example, waiting for the "breakout" confirmation of a pattern reduces the risk of premature trades. It’s like waiting for the traffic light to turn green instead of assuming it’s safe to cross. Pakistani traders can combine this with local market hours and economic announcements to choose the best time to enter or exit the market.
Learning to spot and interpret these patterns brings practical benefits: it reduces guesswork and helps traders act on clearer signals, enhancing confidence and improving results.
Summary: Chart patterns are not just abstract shapes; they translate market psychology into visible signals, helping traders predict and time trades with greater accuracy. Understanding them is a foundational step for anyone serious about forex trading, especially in Pakistan’s dynamic market.
Understanding common forex chart patterns is vital for traders who want to decode market behaviour and make better decisions. These patterns provide hints about possible future price movements by reflecting the collective psychology of market participants. For instance, recognising when a reversal might occur can help you exit losing trades early or enter profitable positions on time.
Head and Shoulders is a well-known reversal pattern signalling a change in trend direction. The pattern has three peaks: a higher peak (head) flanked by two lower peaks (shoulders). Once the price breaks the 'neckline'—a support level connecting the lows between the peaks—it often signals that an uptrend is ending and a downtrend may follow. Pakistani traders can use this to guard against sudden rupee depreciation or to time reversals in currency pairs like USD/PKR.
Similarly, Double Top and Double Bottom are simpler reversal patterns. A double top features two peaks at roughly the same price, marking resistance, followed by a price drop. The double bottom shows two lows at similar levels, indicating strong support before an uptrend. For example, if the USD/JPY pair forms a double bottom on a daily chart, it could hint at bullish sentiment returning.

Triangles come in three types—ascending, descending, and symmetrical—and indicate a pause in the current trend before continuing the same direction. An ascending triangle shows flat resistance and rising support, often breaking upward, while a descending triangle has flat support and lowering resistance, generally breaking downward. Symmetrical triangles represent indecision but tend to break in the direction of the previous trend. Knowing these helps traders hold positions through consolidation phases instead of exiting prematurely.
Flags and Pennants appear after strong moves and usually signal continuation. Flags look like small rectangles slanting opposite the trend, while pennants form small symmetrical triangles. Both represent brief pauses as the market catches its breath. For example, after a sharp rally in EUR/USD, spotting a flag pattern on the hourly chart indicates the bullish run may resume, giving confidence for entering trades with tight stop-losses.
The Cup and Handle pattern resembles a rounded bottom (the cup) followed by a small consolidation (the handle). It often suggests bullish continuation after a period of accumulation. Pakistani traders might notice this in pairs exhibiting steady growth, using it to identify breakout opportunities with clear entry points.
Wedges are slanting trendlines that converge, indicating a potential reversal or continuation depending on context. A rising wedge after an uptrend suggests weakening momentum and possible decline, while a falling wedge signals a likely rise. This pattern gives traders early warnings to adjust their strategies accordingly.
Recognising these common patterns can greatly improve forex trading by enabling timely entries and exits, which is especially beneficial during volatile sessions in markets like PKR against USD or EUR.
Each pattern must be combined with other tools and confirmations for better accuracy, but grasping their meanings forms the foundation of effective technical analysis.
Forex chart patterns reveal the behaviour and sentiments of market participants. Understanding how to read them helps you spot potential price moves early, improving your chances of making profitable trades. This section breaks down how you can identify these patterns on various price charts, then use them to plan your entries and exits wisely.
Timeframe choice greatly affects the reliability of chart patterns. For short-term trades, 15-minute to 1-hour charts work well, capturing intraday market swings. For intermediate trading, daily charts provide a clearer view of ongoing trends without the noise of smaller timeframes. Longer-term investors tend to look at weekly or monthly charts to identify major reversals or breakouts.
Focusing on multiple timeframes helps confirm patterns. For example, a double bottom on a daily chart backed by bullish signals on a 4-hour chart can give you more confidence in entering a buy trade. In Pakistan’s forex markets, where volatility spikes around economic news, daily charts often offer a good balance between responsiveness and signal clarity.
Manual identification of patterns can be tricky, especially in volatile markets. Many trading platforms popular in Pakistan, like MetaTrader 4 and TradingView, offer built-in tools to draw trendlines, channels, and shapes which aid in spotting patterns. Additionally, automated pattern recognition indicators can highlight common formations such as triangles or head and shoulders.
Besides visual tools, using volume indicators can help confirm patterns. For instance, an increase in volume during a breakout supports the validity of the move. Pakistani traders should explore these platform features to avoid missing vital patterns and enhance their chart reading skills.
Once you spot a pattern suggesting a price move, defining stop-loss and take-profit points is crucial to manage risk. Typically, the stop-loss is placed just outside the pattern’s boundary — for example, below the neckline in a head and shoulders pattern. This prevents losses if the price reverses unexpectedly.
Take-profit targets are often set based on the height of the pattern projected from the breakout point. For instance, if a triangle pattern spans 100 pips in height, traders expect a similar movement after the breakout. This method helps keep your risk-reward ratio in check, which is vital when trading forex with Pakistan Rupee pairs prone to sharp swings.
Chart patterns alone don’t guarantee a price move; confirming signals increase reliability. Commonly used indicators such as the Relative Strength Index (RSI), Moving Averages (MA), and the Moving Average Convergence Divergence (MACD) can validate patterns.
For example, if a breakout from a cup-and-handle pattern happens along with RSI moving above 50 and MACD crossing positive, these combined signals suggest higher momentum, supporting the trade decision. Pakistani traders often blend these confirmations to adapt to local market volatility and economic events.
Reading and using forex chart patterns is a skill built over time. Combining pattern recognition with proper timeframe selection, technical tools, and risk management strategies boosts your edge in Pakistan’s fast-moving currency markets.
Accessing well-prepared PDFs on forex chart patterns can make a significant difference for traders looking to sharpen their skills. These digital documents serve as handy resources where you can study the complexities of chart patterns at your own pace. Especially in Pakistan, where internet access can fluctuate, having a PDF means you don't rely on being online all the time. This ease of access fosters continuous learning, allowing you to review patterns offline whenever you want.
PDFs provide the convenience of storing a rich collection of information directly on your device. Traders can refer back to definitions, diagrams, and strategies without needing constant internet connection. For example, a trader in Karachi might be travelling through areas with unstable internet yet still want to review the ‘Head and Shoulders’ pattern—PDFs let this happen smoothly. This functionality also ensures that important notes or highlights remain readily available for quick review.
Charts and patterns are better understood visually. PDFs typically contain clear diagrams showing how forex chart patterns form over time. Seeing colourful candlesticks and trend lines side-by-side with explanations helps you grasp the concept much faster than plain text alone. When you spot complex shapes like ascending triangles or pennants on your trading platform, recalling these visuals from a well-crafted PDF guides you in recognising them with more confidence.
Websites dedicated to forex education, like Babypips or Investopedia, often offer free high-quality PDFs crafted by experts. These include detailed explanations and real market examples, which help build a strong foundation. For Pakistani traders, choosing such sites ensures the content has a global perspective with practical applications, avoiding misleading or overly generic advice.
Many brokers like FXTM, IG, or local Pakistan-based platforms provide downloadable PDFs as part of their educational material. These resources often focus on practical trading scenarios and sometimes even incorporate local currency analysis, making them more relevant. Using PDFs from your broker can integrate well with your trading account, giving you context-specific insights directly connected to the platform’s tools.
Look for PDFs that incorporate examples relevant to the Pakistani market, such as analyses including the PKR/USD pair or economic events like SBP policy rate changes. Material that adapts global patterns to local market conditions will give you better context and actionable insights. For instance, how rupee volatility affects chart patterns can be a crucial addition that generic PDFs often miss.
The forex market is always evolving. Reliable PDFs should feature the latest developments, including new technical tools or changes in market behaviour due to global events or Pakistani economic policies. A PDF published in 2024 would ideally address recent fluctuations caused by geopolitical tensions or updated trading regulations. Staying current avoids wasted effort on outdated or irrelevant strategies.
Keeping a few trusted PDFs on your device is like having a personal forex tutor available anytime, blending theoretical knowledge with practical trading edge tailored to Pakistan’s unique market dynamics.
By choosing quality, localised, and visually rich PDFs, Pakistani forex traders can improve their understanding and trading results significantly. Whether offline or online, these guides serve as essential companions in your trading journey.
Trading forex in Pakistan comes with its own unique challenges and opportunities. To navigate these effectively, traders must adapt forex chart patterns considering local market conditions and integrate them with tools and regulations typical to Pakistan. This practical approach enhances decision-making and helps manage risks better.
The Pakistani rupee often experiences sharp swings due to economic pressures, geopolitical tensions, and fluctuating foreign exchange reserves. These movements can distort typical chart patterns if traders do not account for the heightened volatility. For example, while a head and shoulders pattern might signal a reversal in stable markets, in Pakistan’s forex market, abrupt rupee devaluations following government announcements can lead to false breakouts.
Therefore, traders should combine pattern analysis with an understanding of recent rupee behaviour. Using wider stop-loss limits or avoiding tight setups during uncertain times can prevent premature exits. Also, focusing on longer timeframes (daily or weekly charts) often filters out market noise caused by short-term volatility.
Pakistan’s frequent economic announcements, such as State Bank of Pakistan’s monetary policy decisions, IMF programme negotiations, or fiscal budget releases, have strong influence on currency prices. Chart patterns formed in the lead-up to these events may work differently because sudden news can trigger unexpected price spikes.
Traders should keep an eye on the economic calendar and treat chart patterns cautiously around major policy events. For instance, a continuation pattern forming before an interest rate hike might break unpredictably. Incorporating fundamental awareness into technical trading helps avoid costly mistakes.
Pakistani forex traders mainly use platforms offered by local brokers such as CMC Markets Pakistan or international brokers registered with the Securities and Exchange Commission of Pakistan (SECP). These platforms often have integrated charting tools, including pattern recognition features tailored to local user needs.
Traders benefit by selecting brokers that provide reliable forex data for PKR pairs and seamless integration with mobile and desktop apps common in Pakistan. Additionally, prompt customer support in Urdu or English helps clarify chart insights and trading signals. A trader using a local platform will often get faster execution which is critical during volatile price moves.
Forex profits are subject to taxation under the Federal Board of Revenue (FBR) rules. Traders should maintain accurate records of all trades, including dates, entry and exit points, and profit/loss amounts. Proper bookkeeping helps when submitting returns or facing audits.
Chart patterns assist in timing trades, but proper documentation of these trades makes it easier to justify gains and losses to tax authorities. Moreover, Pakistani regulations may affect forex trading limits and account requirements — knowing these helps integrate technical analysis with compliant trading strategies.
Adapting forex chart patterns to Pakistan’s market conditions and combining them with local trading tools and rules is more than a technical exercise. This approach safeguards capital and increases the chances of consistent profits in a market known for its unpredictability.
📈 Learn how forex chart patterns reveal price trends, helping Pakistani traders make smarter entry and exit calls for better trading success in local markets.

📊 Explore key chart patterns traders use to read market trends effectively. Learn types, traits, and what they signal to sharpen your trading skills today.
📊 Explore essential chart patterns in detailed PDFs for smarter trading decisions. Find reliable resources and master technical analysis today! 📈

📈 Explore forex trading training essentials for Pakistani traders: skills, strategies, course structures, and tips to navigate market challenges confidently.
Based on 13 reviews