

Guide to Chart Patterns in Trading
📊 Explore key chart patterns traders use to read market trends effectively. Learn types, traits, and what they signal to sharpen your trading skills today.
Edited By
James Harwood
Trading chart patterns offer traders a visual tool to predict market movements in stocks, forex, and commodities. These patterns represent repeated price behaviours driven by market psychology, helping traders identify potential trend reversals or continuations.
Understanding chart patterns can improve your entry and exit decisions, reducing reliance on guesswork. For instance, a head and shoulders pattern might signal a weakness before a price drop, while a double bottom could indicate a bullish reversal.

PDF resources that compile key patterns provide an easy reference, especially for Pakistani traders who juggle local market nuances alongside global trends. These guides typically include illustrations of pattern shapes, their volume behaviour, and the typical price targets after breakout.
Mastering a handful of reliable patterns boosts your trading strategy, enabling you to manage risk and spot opportunities in the hectic market environment.
Common patterns include:
Triangles (ascending, descending, symmetrical): often signal consolidation before a breakout in either direction.
Flags and Pennants: short-term continuation patterns after a sharp move.
Cup and Handle: a bullish continuation pattern signalling potential upward momentum.
Using chart pattern PDFs alongside live charts helps build confidence. Tools like MetaTrader, TradingView, and Pakistani platforms provide real-time data to test these patterns practically.
For traders based in Pakistan, it is helpful to understand how these patterns perform in local markets like the Pakistan Stock Exchange (PSX), where volatility and market psychology might differ from international markets.
In this guide, you will find clear explanations of key patterns, how to spot them, and downloadable PDFs to keep handy during your trading sessions. This practical approach helps you make timely decisions and control losses better.
Chart patterns are fundamental tools for traders and analysts across markets, including stocks, forex, and commodities. Understanding these patterns equips you to read market movements more effectively, anticipate potential price shifts, and manage risks better. This section explains what trading chart patterns are, why they matter, and highlights some common examples you are likely to encounter.
Trading chart patterns are specific shapes or formations created by price movements on a chart. They reflect the balance of supply and demand in the market and help predict future price action. Technical analysts use these patterns to make informed guesses about where prices might head next, often without relying on company fundamentals. For instance, spotting a "Head and Shoulders" pattern on a stock chart could signal a possible trend reversal, prompting sellers to prepare for a downturn.
Chart patterns provide a visual window into the collective behaviour of market participants. Prices move as traders react to news, rumours, and technical signals, creating patterns that reflect fear, optimism, or indecision. A double top pattern, for example, shows sellers stepping in twice at a similar price level, signalling that bulls are losing strength. Recognising these behavioural clues helps traders anticipate market sentiment and align their strategies accordingly.
Reversal patterns indicate that the current market trend is likely to change. The Head and Shoulders pattern, resembling a human head with two shoulders, predicts a shift from bullish to bearish momentum. This pattern often appears at market tops, warning traders to exit or short their positions. Conversely, the Double Bottom pattern forms when prices hit the same low twice before bouncing back, signalling a bullish reversal. In Pakistan’s stock market, such patterns have been observed during volatile phases, helping traders decide on timely entry or exit.
Continuation patterns suggest the current trend will resume after a brief pause. For example, a Flag pattern looks like a small rectangular shape slanting against the prevailing trend, indicating consolidation before continuation. Pennants are small symmetrical triangles showing indecision before a likely breakout. Triangles—whether ascending, descending, or symmetrical—reflect periods where buyers and sellers are nearly equal, often preceding strong moves. These patterns help traders maintain positions with the confidence that trends will continue, which is especially useful in markets affected by sudden news or loadshedding interruptions.
Understanding these basics sharpens your ability to spot meaningful setups, allowing smarter trade decisions. Combine this knowledge with practical experience and PDF resources for better pattern recognition and trading success.

Chart patterns are more than just shapes on a graph; they offer a roadmap for traders to understand market movements. Learning to read and use these patterns effectively can improve your timing in entering and exiting trades, managing risk, and ultimately enhancing profitability. This section focuses on practical insights into how different timeframes impact pattern recognition and how to extract reliable entry and exit signals.
Chart patterns can form over various timeframes, and recognising this helps traders decide when to act. Short-term patterns, such as those on a 5-minute or hourly chart, are useful for day traders or scalpers who want quick profits within the same trading day. For example, spotting a flag pattern on a 15-minute chart of a PSX stock like Engro could signal a short burst in price.
Long-term patterns, captured on daily or weekly charts, are more suitable for investors or swing traders holding positions for weeks or months. A double bottom on a weekly chart might indicate a strong support level forming in a blue-chip stock like Habib Bank Limited. This helps traders avoid reacting to minor fluctuations and focus on more significant trends.
Choosing your timeframe affects your trading strategy directly. A short-term trader relying on quick patterns will set tighter stop-loss levels and smaller profit targets, considering market noise and volatility. Meanwhile, a long-term trader trusts patterns on larger timeframes as stronger signals and can afford wider stop-loss zones and bigger target gains. Picking the right timeframe aligns your trading style with realistic expectations rather than chasing every market twitch.
Setting stop-loss and target levels based on chart patterns is crucial in protecting capital and locking in profits. For instance, in a Head and Shoulders reversal pattern, placing the stop-loss just above the right shoulder for a sell trade limits losses if the pattern fails. The target could be set equal to the height of the pattern projected downwards.
This structured approach keeps emotions in check, replacing guesswork with discipline. Similarly, continuation patterns like pennants provide entry points when price breaks out in the trend direction, guiding precise entries.
Confirming these patterns with volume and indicators adds confidence in trade decisions. Rising volume on a breakout confirms genuine interest and reduces false signals. For example, when a Triangle pattern breaks out on the KSE-100 index, a noticeable increase in trading volume supports the validity of that breakout.
Indicators like RSI (Relative Strength Index) or MACD (Moving Average Convergence Divergence) can spot overbought or oversold conditions, ensuring trade timing aligns with momentum shifts. A trader may wait for RSI to exit the overbought zone before entering a short position after spotting a reversal pattern on a stock chart.
Successful traders combine pattern recognition with volume and technical indicators to filter out noise and make informed decisions. This approach helps manage risks and improve entry-exit timing in Pakistan’s often volatile markets.
By understanding how to spot chart patterns across different timeframes and how to confirm entry and exit signals with volume and indicators, you enhance your chances of consistent trading successes. This knowledge forms the foundation for developing adaptable strategies tailored to your trading goals and market context.
PDF guides on trading chart patterns are a valuable resource for traders and analysts, helping them study and apply these patterns systematically. They condense complex technical concepts into clear visuals and step-by-step explanations, making it easier to understand how patterns form and what signals they give in different market conditions. Trustworthy PDFs often serve as handy references during market analysis, especially for traders wanting to improve accuracy without relying solely on expensive courses or software.
There are both local Pakistani and international sources offering quality PDF materials on trading chart patterns. Pakistani websites dedicated to financial education or brokerage firms often provide regionally relevant PDFs that consider local market dynamics like rupee fluctuations or stock volumes on Pakistan Stock Exchange (PSX). International platforms such as Investopedia, BabyPips, or established trading academies also offer comprehensive PDFs, which can be adapted for Pakistani markets with some practice.
Before downloading any guide, it’s essential to confirm authenticity and ensure the document is up to date. PDFs from official finance portals, recognised trading educators, or well-known brokerage houses are generally trustworthy. Older resources might miss recent market developments or new pattern interpretations. Checking the last update date and cross-referencing with latest market data safeguards traders against outdated strategies.
Merely reading PDFs is not enough to sharpen trading skills; practising pattern recognition actively is key to improvement. Traders should take PDFs to charting platforms like TradingView or MetaTrader and match real-time stock or forex charts to examples in the guides. Consistent practice helps in internalising pattern nuances and spotting subtle variations, which boosts confidence in live trades.
Integrating PDFs with digital tools enhances their value. Many Pakistani traders combine manual study from PDFs with alerts provided by apps like PSX Trading or brokerage platforms supporting real-time notifications. For instance, after studying how a “double top” pattern signals reversal, traders set alerts to catch such formations as they unfold on screens. This combination of traditional learning and modern technology ensures timely decisions and better risk management.
Using PDF guides along with practical trading tools creates a balanced approach where knowledge meets action, vital for success in today’s dynamic markets.
In summary, reliable, up-to-date PDF resources form a strong foundation in understanding trading chart patterns. Reading them actively and linking the insights to market practice through digital platforms is the way forward for Pakistani traders aiming to trade smartly and efficiently.
Practical examples are essential to understand how chart patterns work beyond theory. They give traders a chance to see real market behaviour and how these patterns provide actionable signals in the Pakistan Stock Exchange (PSX) and other markets. Observing actual case studies improves pattern recognition skills and sharpens entry and exit timing.
Reversal patterns often signal the end of a trend and the start of a new direction, which can be highly profitable for traders if identified correctly. For instance, the Head and Shoulders pattern is regularly observed in PSX stocks like Oil & Gas Development Company Limited (OGDCL). When OGDCL’s price approached a peak followed by a lower peak and finally a break below the neckline, many traders capitalised on this reversal to short the stock or exit long positions.
Double Top or Double Bottom patterns also occur frequently in volatile sectors such as banking. For example, after a sustained upward move, Habib Bank Limited (HBL) showed a double top formation indicating resistance and upcoming price correction. Recognising such patterns supported timely exits, reducing losses or locking in profits.
Commodity trading in Pakistan, especially in the oil and gold markets, benefits from continuation patterns like flags, pennants, and triangles. For example, the crude oil futures traded on international exchanges but monitored closely by Pakistani traders often show flag patterns after a strong price move. This indicates a brief pause before the trend resumes.
Similarly, gold prices have exhibited pennant formations during consolidation phases. Traders using these patterns with volume confirmation tend to anticipate continuation accurately, aligning their positions accordingly. This improves risk management by avoiding false breakouts common in commodity markets.
Volume is a critical factor confirming chart patterns. A common mistake is spotting a pattern without verifying if the volume supports it. For example, a breakout from a triangle pattern with low volume tends to fail more often, misleading traders into premature trades.
Ignoring volume might cause entry on false signals, resulting in losses. Pakistani traders should always compare volume spikes or drops alongside price changes, especially in illiquid stocks or during volatile sessions. Tools like volume overlays on trading platforms help avoid this pitfall.
Charts alone cannot capture macroeconomic events or sector-specific fundamentals affecting price movements. For instance, anticipating a bullish breakout based purely on a continuation pattern in a stock heavily impacted by negative economic news or rupee depreciation could lead to losses.
Local factors such as government policy changes, foreign exchange volatility, or global commodity fluctuations significantly affect market direction. Traders must combine pattern analysis with these fundamentals rather than relying blindly on charts. This balanced approach improves trade decisions and minimises unexpected risks.
Practical examples and recognising typical errors equips traders to use chart patterns effectively in Pakistan’s unique market environment. Integrating volume, fundamentals, and context alongside patterns maximises trading success while controlling risk.
Trading chart patterns can guide decisions, but Pakistani market conditions call for some local adjustments. Understanding these nuances helps you avoid common pitfalls and enhances your chances of success. This section focuses on practical tips that consider the realities of Pakistan’s financial markets, currency fluctuations, and infrastructural challenges.
Impact of rupee volatility and economic events
The Pakistani rupee often experiences sharp swings due to factors like foreign exchange reserves shifts, political developments, or economic policy announcements. Such volatility can distort usual chart patterns or cause false breakouts. For instance, rupee depreciation might lead to sudden price surges in export-heavy stocks even if the underlying technical pattern signals otherwise. Traders need to cross-check economic calendars and keep an eye on major announcements from the State Bank of Pakistan (SBP) and the government. Incorporating fundamental context prevents relying solely on patterns, which might behave unpredictably during unstable currency phases.
Considering loadshedding and liquidity issues
Loadshedding affects not just daily life but also trading workflows, especially for retail traders working from home. Interruptions in power or internet can delay trade execution or prevent timely exits. In addition, liquidity levels in the Pakistan Stock Exchange (PSX) can be lower compared to global markets, leading to wider spreads and less reliable pattern formations. To cope, many traders set automated stop-loss orders and use mobile-friendly trading apps to maintain connectivity even during outages. Awareness of peak loadshedding hours helps in planning trades around more stable periods.
Popular trading apps and platforms in Pakistan
Platforms like PSX’s official web portal, brokers’ desktop software, and mobile apps such as EasyEquities and Mettis Global are widely used, offering live data and charting tools. JazzCash and Easypaisa wallets have also enabled easier fund transfers to brokers, speeding up investment actions. These apps often integrate technical indicators with chart pattern visuals, helping traders confirm signals from PDF study materials. Relying on trusted apps reduces the risk of outdated charts or delayed information.
Combining manual study with automated alerts
A balanced approach involves studying chart patterns through PDFs or printed guides and using automated alerts for execution signals. Many platforms allow setting custom notifications for price levels, volume spikes, or pattern completion. This synergy means that even if you’re away from your desk or dealing with loadshedding, you get timely updates to make informed decisions. For example, if a Trader ABC app sends an alert on a head-and-shoulders pattern breakout, you can quickly review charts on your phone and place orders before the market moves.
Successful trading in Pakistan blends pattern knowledge with smart tech use and awareness of local market quirks. Adjusting strategies to these realities leads to better timing and risk control.
📊 Explore key chart patterns traders use to read market trends effectively. Learn types, traits, and what they signal to sharpen your trading skills today.

📊 Explore essential chart patterns in detailed PDFs for smarter trading decisions. Find reliable resources and master technical analysis today! 📈

Learn to spot bearish chart patterns 📉 with clear signs of market weakness. Understand their traits and apply them to improve your trading in Pakistan's markets.
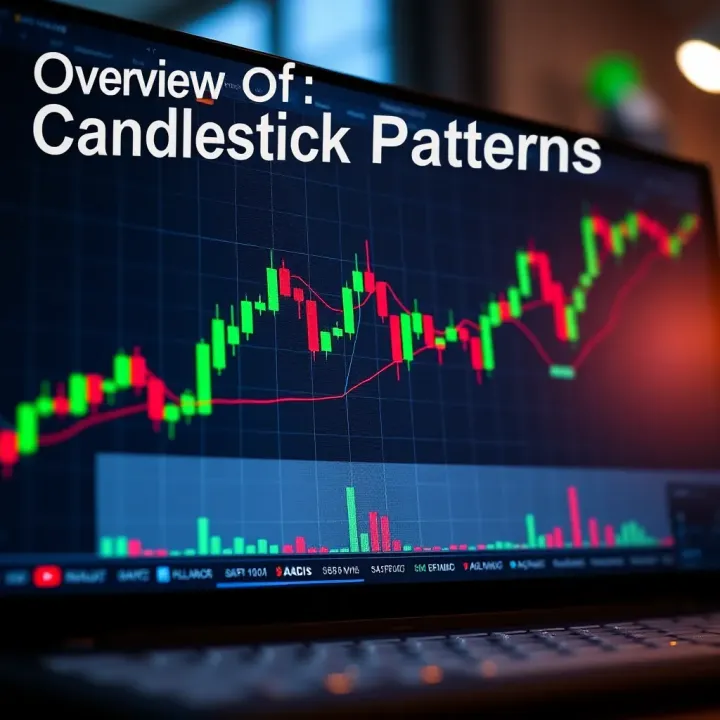
📈Explore key & advanced candlestick patterns for traders in Pakistan. Learn to spot, read & use them effectively. Plus, get helpful PDF guides for offline study! 📊
Based on 12 reviews